Purpose
Considerable enthusiasm exists for the concept of having living roots in the soil at all times, but very little data is available to show yield impacts either long or short term. Unfortunately, while the enthusiasm for this idea is real, there has been a regression towards more tillage in Ontario, especially in certain areas, over last 5 years. While there is no survey data on this shift, virtually every agronomist agrees that it is extremely significant & disheartening from both a soil erosion & soil health standpoint. This means that coordinated trials for comparative data under Ontario conditions are essential. The Thames Valley/Heartland Tier 2 project of 2015-2018 showed significant negative impacts on yield in both corn and soybeans in the “plant green” plots compared to other treatments. These yield losses appeared to be associated with poor slot closure, as well as more inconsistent seed to soil and soil to plant contact. After 3 years of the project, no increase in soil health could be measured. This project continues the Thames Valley/Heartland Tier 2 “Roots Not Iron” project, with adjustments to the “plant green” treatment that will hopefully overcome the challenges noted above in the original project. The majority of the sites will continue on from the original project, which should give an extended period of time for soil health improvements to develop and be measured. That being said, soil health declines far more rapidly than it can be remediated and farmers who buy into the concept of enhancing soil health understand it’s a long-term commitment.
Methods
Three replicate field scale trials were established to continue assessing the Roots Not Iron concept. The treatments continue in the same location at established sites. Minor adjustments were made to the original protocol. The seeding rate of the mutti-species cover crop planted after wheat was reduce from 110lbs/acre to 50lbs/acre, and spring strip-till will be performed before corn planting to hopefully address slot closure and soil contact issues. Cereal rye planted after corn harvest replaced annual ryegrass interseeded at V6. Full details of each treatment are listed below.
- Cooperators current conventional best management practices with no cover crop. Tillage following co-operators normal practice.
- Standard best management of cover crops including clover in wheat (reseed with oat/pea mix if poor establishment), burn down in fall. Tillage following co-operators normal practice.
- #RootsNotIron (green all the time) A multi-species (minimum 8 species) cover crop containing a mixture of oats, radish, clover, cereal rye, sunflower, peas, phacelia, sun hemp will be planted after wheat harvest and left to over winter. The cover crop will be terminated in the spring and strip tilled prior to corn planting. Cereal rye will be planted following corn harvest and will be terminated in the spring, prior to no-till soybeans being planted.
Baseline soil health assessments (Solvita test for biological activity) and ON-CSHA (Cornell Soil Health Assessment) were taken at the end of the Roots Not Iron 1.0 project and will be taken again at the end of the Roots Not Iron 2.0 project to measure longer term (6 year) soil impacts, to explore the potential to measure phosphorous movement, nitrogen cycling etc.
Applications of manure as desired by individual cooperators applied consistently across all treatments and repetitions, with manure nutrient values taken into consideration.
Results
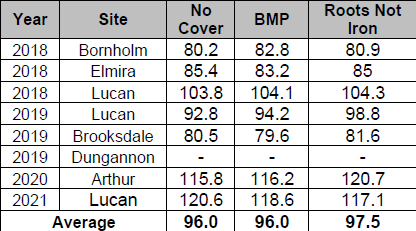
The wheat yield results are shown in table 1. The Dungannon site in 2019 was discarded due to variability caused by winter kill. Results were mixed across locations but overall there was a slight trend toward higher yields in the Roots not Iron treatment.
Table 1: Wheat Yield Results (bu/acre)
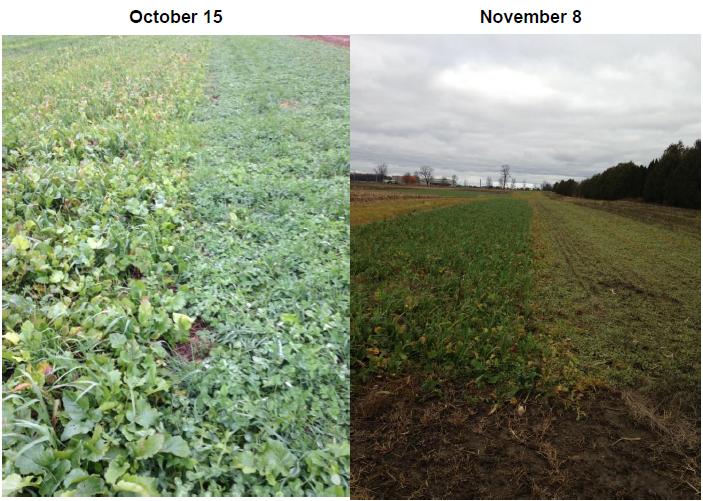
Cover crop biomass measurements were taken in early November. These measurements do not account for root growth but give an indication of how much above ground residue has been created. A 70% oats, 30% peas mixture was planted in the BMP treatment at the Lucan locations in both 2017 and 2018 due to poor clover establishment. The fall cover crop growth at the Bornholm location is shown in image 1. The picture on the left was taken on October 15th 2018, while the picture on the right was taken November 8th 2018 a couple weeks after the clover was desiccated.
Table 2: Fall Cover Crop Biomass After Wheat (Tonnes/acre)
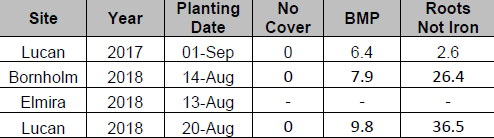
Image 1: Multi-Species Mix and Single Cut Clover (BMP) at Bornholm
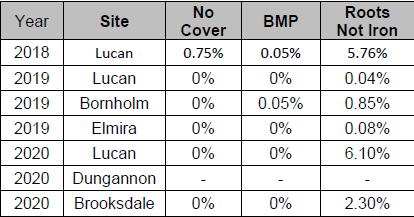
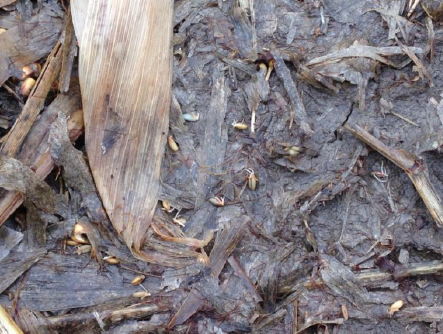
The corn results are shown in tables 3, 4, and 5. In 2018 spring cereal rye growth was variable with some winter kill occurring in lower areas of the field but overall winter survival was good. In 2019 very little rye overwintered while the tillage radish did, which was unexpected. Wet weather during the spring of 2019 delayed planting until June at both the Lucan and Bornholm locations. By the time the tillage radish was finally terminated it was already in full flower (image 2). Image 3 shows the amount and colour of the cover crop residue when the corn began to emerge in 2018 and 2019. In 2018 most of the greenness came from the terminated cereal rye while in 2019 most of the greenness came from vetch. Greenness ratings were taken on the same day as the corn first emerged (Image 3) and are shown in table 3. Greenness ratings were conducted using the Canopeo app, developed by the Soil Physics Research Group at Oklahoma State University. It gives an indication as to how much of the ground is covered by green plant material.
Image 2: Cover Crop Growth May 21st 2019 (Lucan)
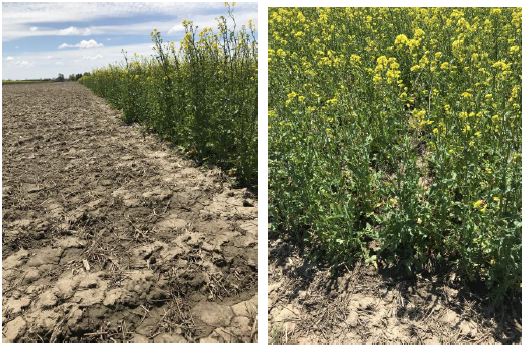
Image 3: Cover Crop Growth at Lucan 2018 (left) and Elmira 2019 (right)

Table 3: Greenness Rating
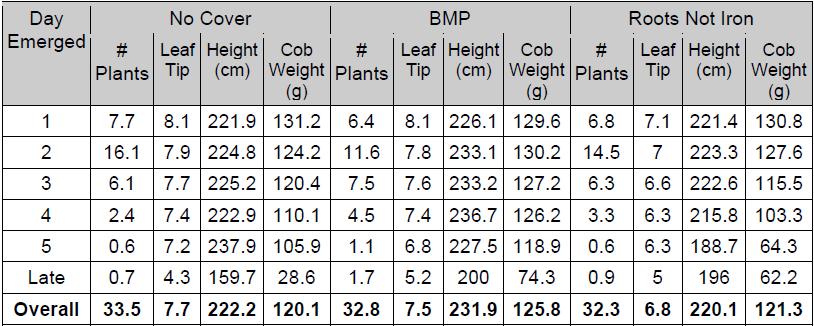
Plants were tracked through the growing season to determine the impact that the 3 treatments have on plant emergence, rate of growth, and plant height. Table 4 shows the number of plants that emerged each day based on 5.3 meter length of row (1/1000 acre).
Leaf tips were counted on June 15th in 2018 and July 12th in 2019. The results from the No Cover and BMP treatments are very similar for plants that emerged on the same day. However, the plants in the roots not iron treatment are almost an entire leaf behind. This is consistent with the outcome found in the initial project. No data was collected in 2020.
Plant heights were variable based on day of emergence. Overall the BMP treatment was the tallest while there was little difference in height between the No Cover and Roots not Iron treatments.
There is a lot of variability in cob weight based on day of emergence but overall there is downward trend in all treatments with delayed emergence. Overall plants that emerged on day 3 yielded 6.5% less then plants that emerged on day 1.
Table 4: In Season Corn Measurements
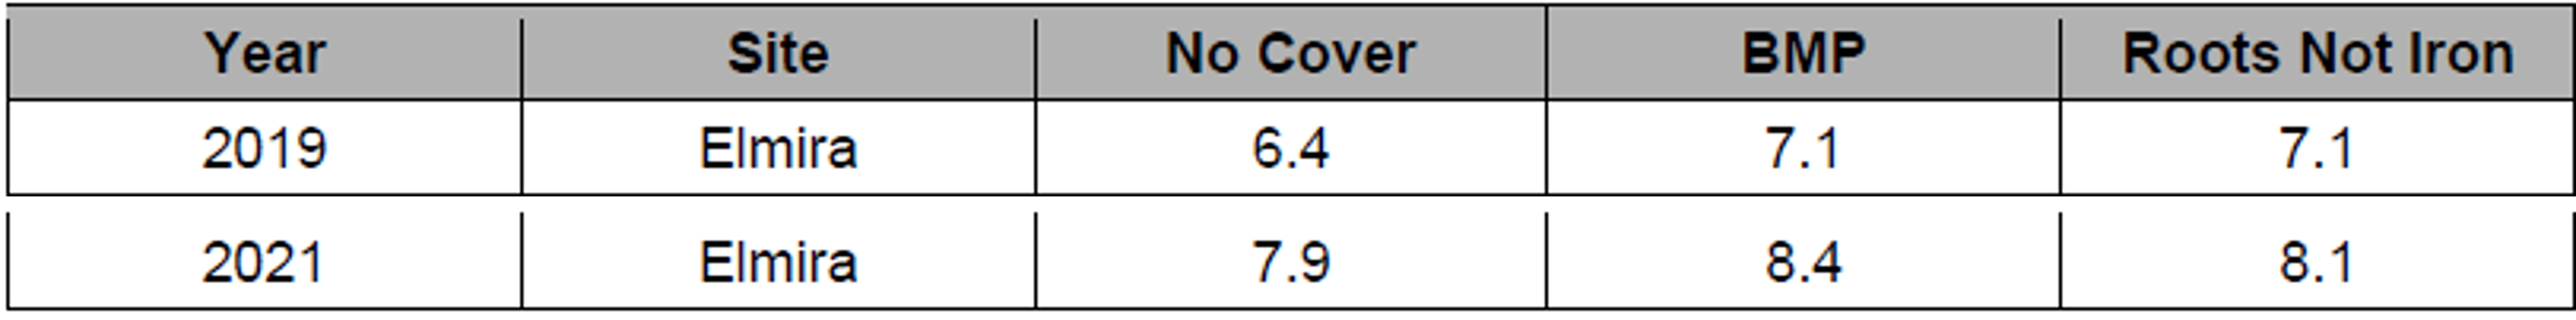
Corn yield results are shown in table 5. In 2019 and 2021 the Elmira location was harvested as corn silage and those results are shown in table 6. On average there is very little difference in grain yield between treatments, which is a drastic improvement compared to the results from previous trials. In the roots not iron 1.0 project the roots not iron treatment yielded 16.6 bu/acre less than the no cover treatment. The improved results from the roots not iron treatment could potentially be due to the introduction of strip-till, improved soil health, or poor and variable rye establishment in the treatment. The locations that had reduced yields in the Root not Iron treatment tended to have higher greenness ratings at corn emergence (table 4).
Table 5: Corn Yield Results (bu/acre)
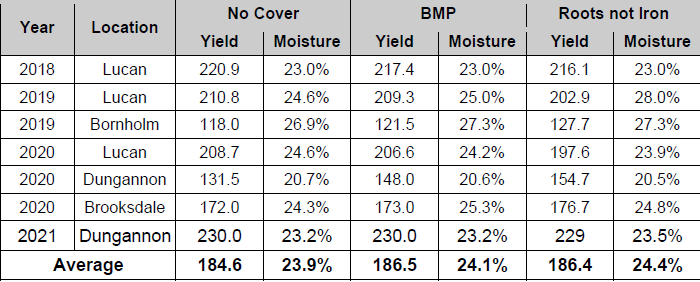
Table 6: Corn Silage Yield (DM tonnes/acre)
The soybean yield results are shown in table 7. The Brooksdale location had to be reseeded due to variable seedling emergence and the results have been discarded. The results from the Dungannon location should be viewed separately from the rest of the data as there was no annual ryegrass cover crop seeded in the roots not iron treatment. Due to a severe rain event that occurred on June 22nd 2017 at Dungannon we were not able to inter-seed annual ryegrass into the corn crop. Overall soybean yields have been outstanding at all locations. Except of the 2020 Elmira location there has been little differnce in yield between treatments, which is an improvement from the first stage of the project which showed a yield loss of 2.2 bu/acre with the roots not iron treatment. One change that was made from the first stage of the project is in the fall of 2018 annual ryegrass was replaced with cereal rye in the roots not iron treatment, making 2019 the first year soybeans were planted into cereal rye during this project. Unfortunately due to wet fall weather in 2018 the cereal rye had to be broadcast following corn harvest as opposed to being planted with a drill. Cereal rye was broadcast at 100 lbs/acre on Nov 22nd at Arthur and Nov 30th at Lucan. Early growth looked promising as shown in image 4, the rye had germinated by Jan 8. Spring rye growth was poor due to cool spring weather. By May 13th many of the rye plants were at the 3 to 4 leaf stage (Image 5). Unfortunately the Lucan soybean location was lost due to uncontrollable circumstances.
A wet spring in 2019 resulted in corn being planted late which pushed corn harvest at many sites to late November. Fortunately a mid December frost presented an opportunity to frost seed cereal rye at Lucan and Bornholm on December 12th Cereal rye was planted at Elmira on October 23rd following silage harvest.
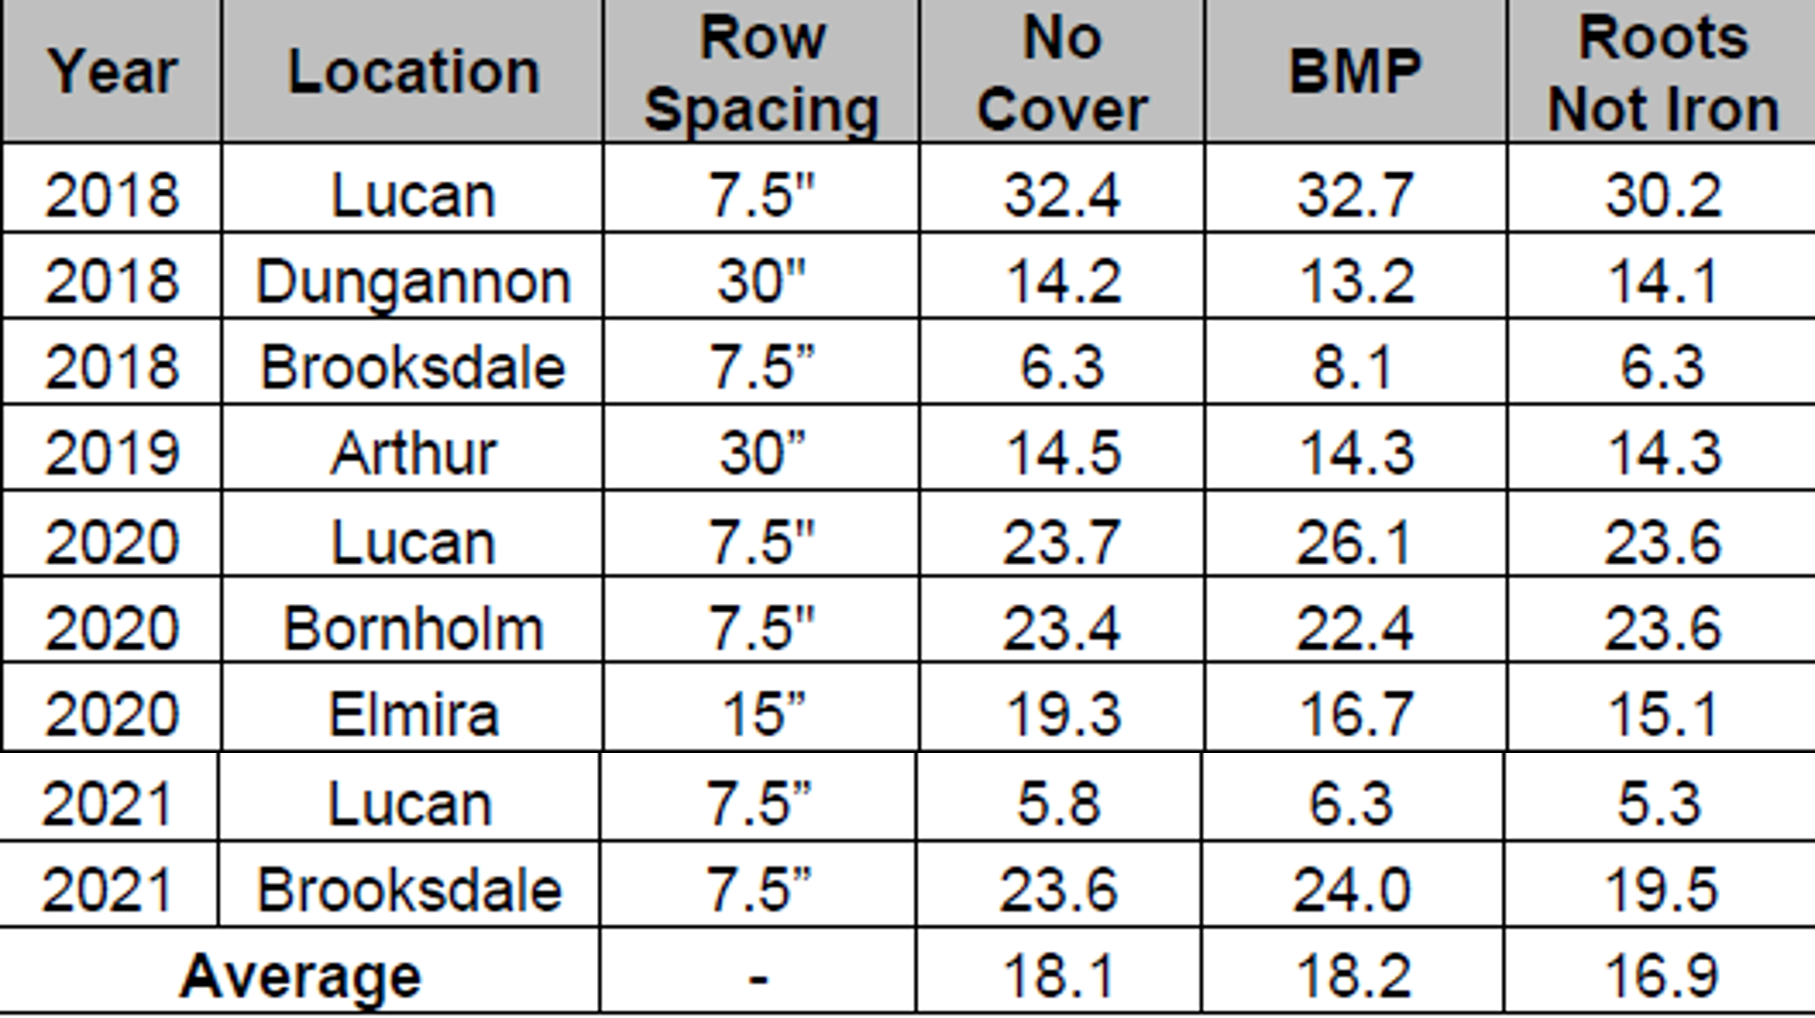
Table 7: Soybean Yields
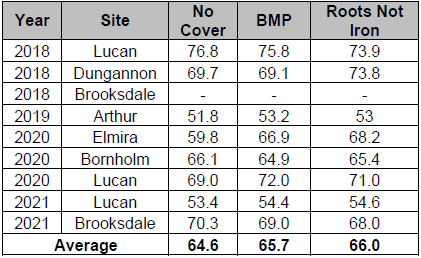
Image 4: Cereal Rye Establishment on January 8th
Annual ryegrass has had a negative impact on stand establishment over the course of the first stage of the project and at Lucan in 2018. Except of the 2020 Elmira location cereal rye has had little impact on stand counts The stand count results are shown in table 8.
The soybean population was reduced by 7% at the 2018 Lucan site in the roots not iron treatment. This is consistent with results from the first stage of this project which showed a 10% stand reduction in the roots not iron treatment while using annual ryegrass. While this did not reduce yields by 10%, it does indicate the problems associated with living roots holding tightly to soil, and the difficulties that this can present when attempting to get good seed to soil contact and close the slot. At the 6 locations either without a living cover crop (Dungannon) or very little cover crop growth (2019 Arthur, 2020 Lucan, 2020 Bornholm) stand count results in the roots not iron treatment were similar to the no cover treatment. There was a substantial stand count reduction at the 2020 Elmira location which could be due to differences in tillage so the roots not iron treatment was planted no-till while the other treatments received spring tillage prior to planting. The Brooksdale location had to be reseeded due to variable seedling emergence as been by the low stand count numbers.
Table 8: Soybean Stand Counts
Soil samples have been collected from each treatment every 3 years. Samples have been sent to Cornell University to be tested for several potential soil health indicators. The soil health results are shown in tables 9 through 16. There is still a lot of debate about what constitutes a healthy soil and what tests are the best indicators of a healthy soil. Organic matter has always been the gold standard for indicating how healthy a soil is but the current thinking is that active carbon and potentially mineralizable nitrogen are two other tests that may be a good indicator of if a soil is healthy or not. A brief explanation of each soil health indicator tested in this study is listed below
- Water Capacity – is a measure of how much plant available water the soil is able to store
- Aggregate Stability- indication of how well wet soil is able to stay together during a rain event
- Organic Matter – measure of the amount of organic carbon material in the soil
- Total Carbon (C) – measurement of the total carbon in the soil, including both organic and inorganic carbon
- Total Nitrogen (N) – the total N in the soil including both organic and inorganic N
- Ace Soil Protein Index – indication of the amount of organically bound N in the soil
- Respiration – a measure of the amount of carbon dioxide released from the soil. Higher carbon dioxide levels indicate a higher rate of metabolic activity
- Active Carbon – the amount of soil organic carbon that is readily available as a carbon food source
- Overall Rating – a combination of all test results into one overall soil health score
Table 9: Bornholm Soil Health Results
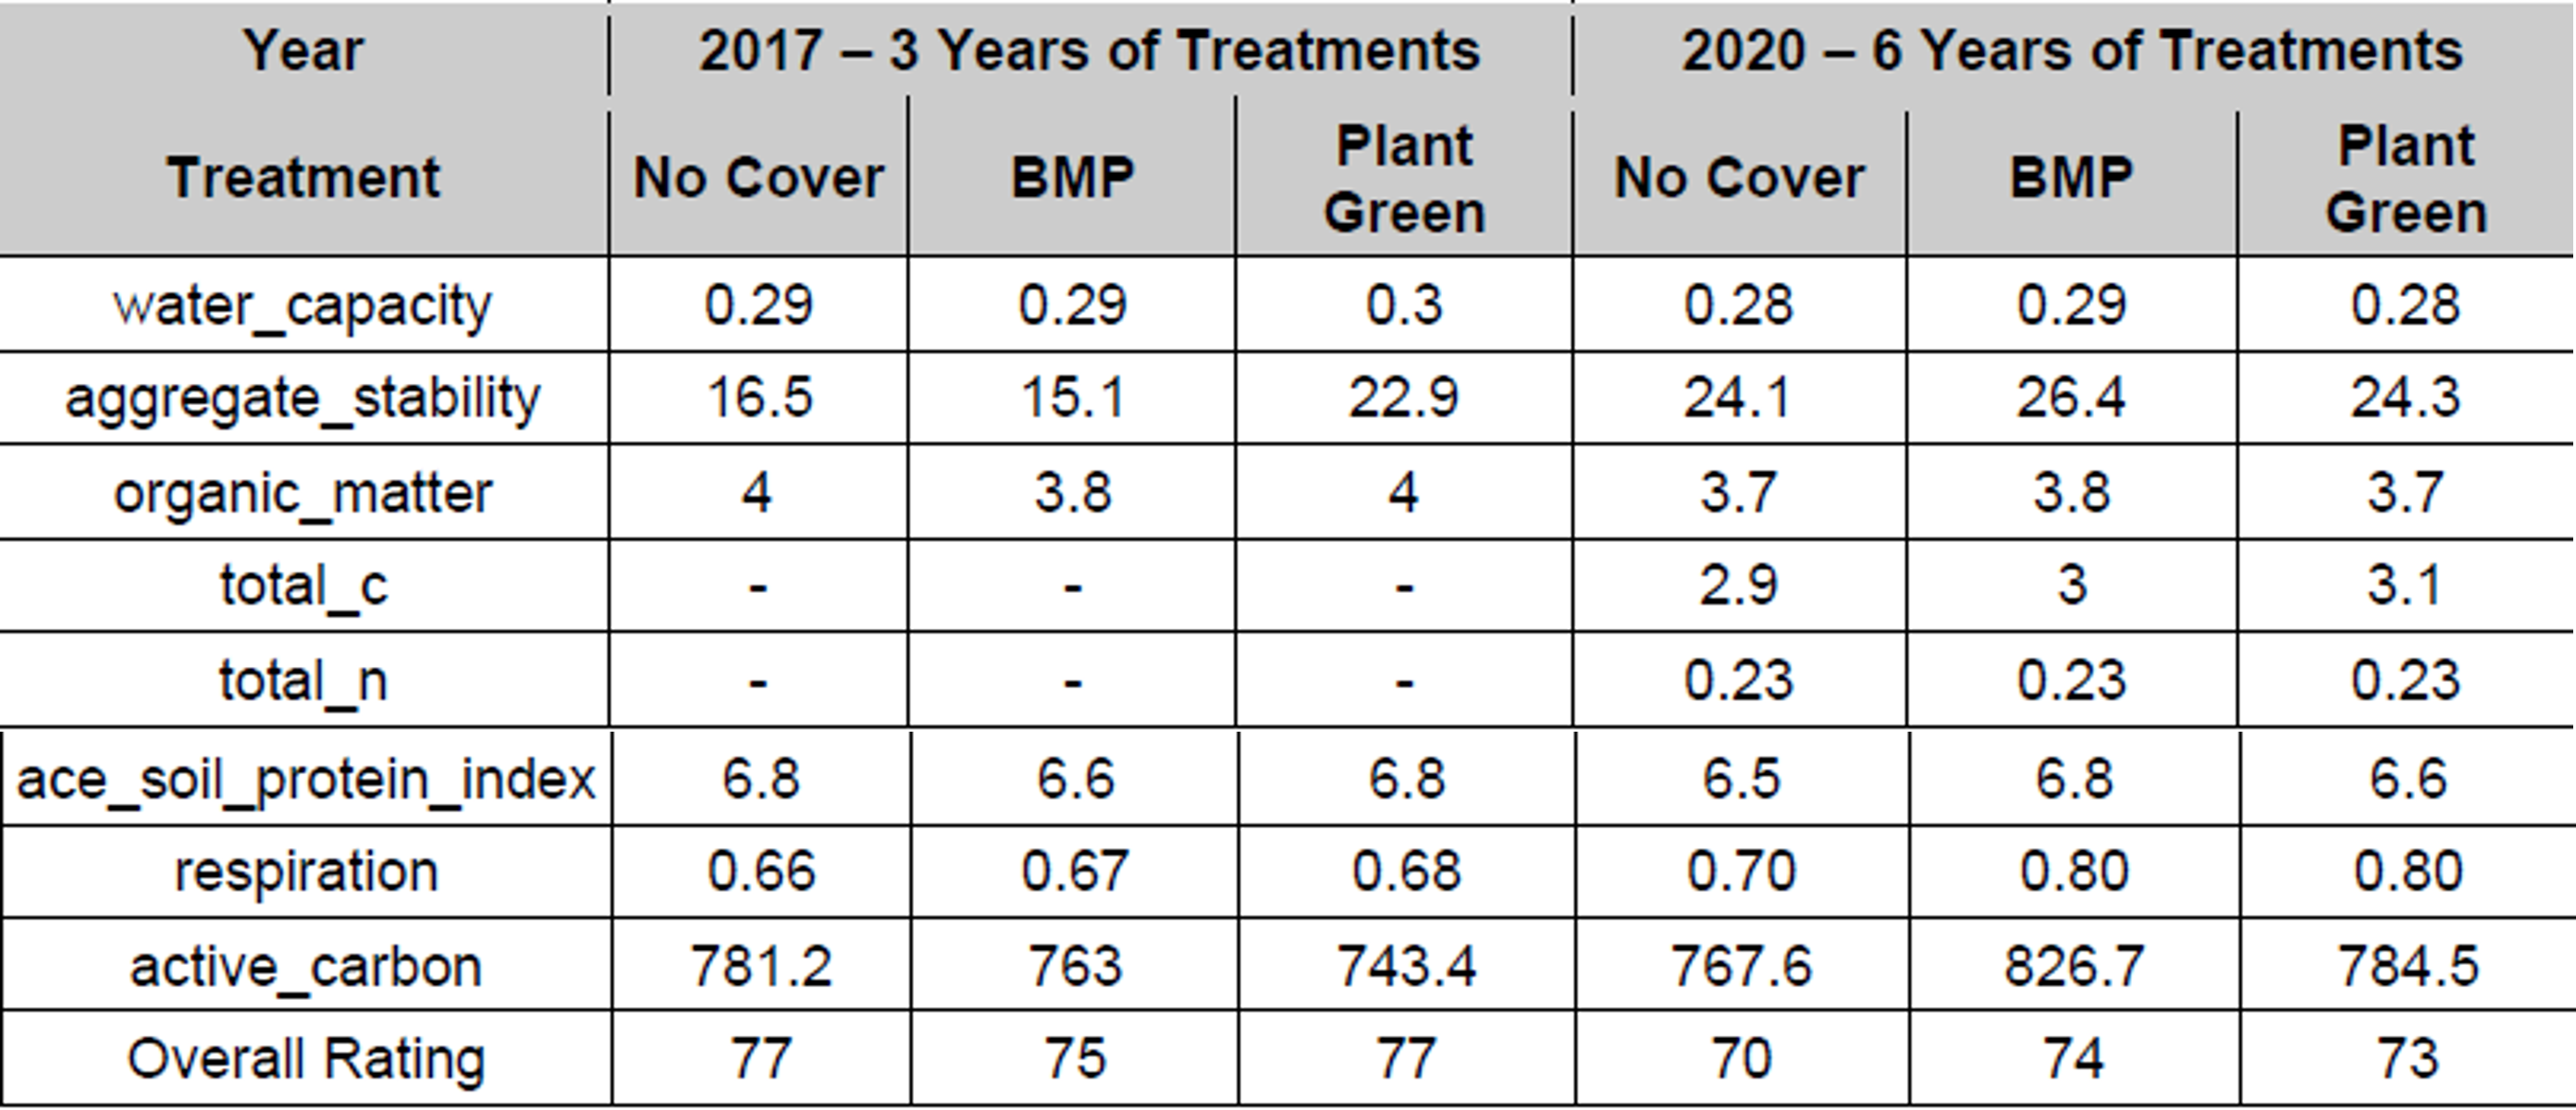
Table 10: Dungannon Soil Health Results
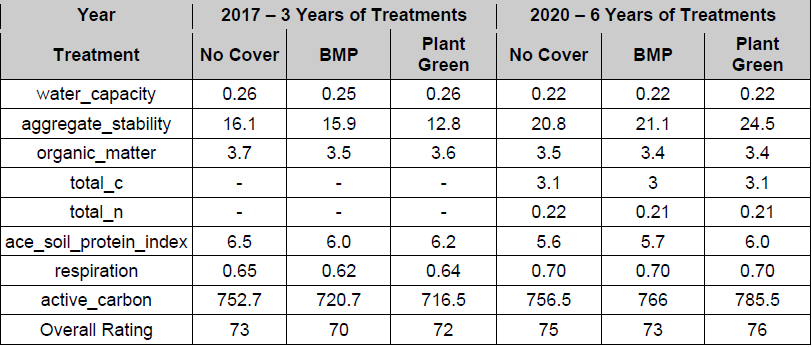
Table 11: Arthur Soil Health Results
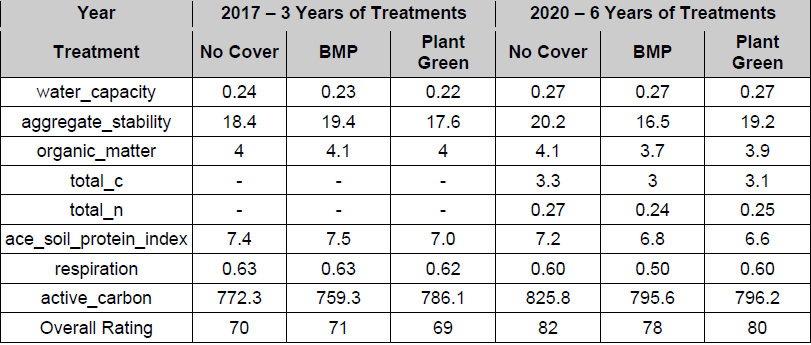
Table 12: Lucan (home) Soil Health Results
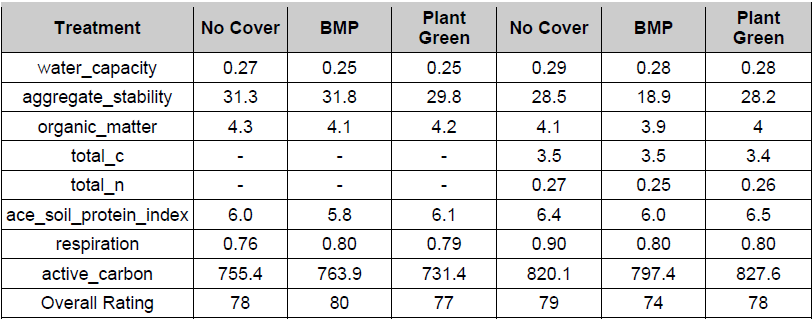
Table 13: Elmira Soil Health Results
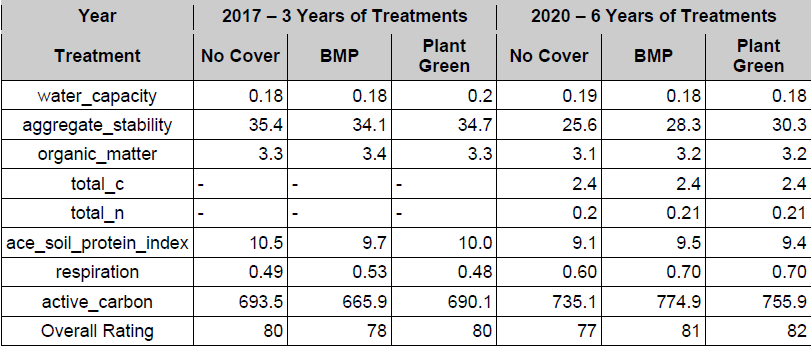
Table 14: Lucan School Soil Health Results
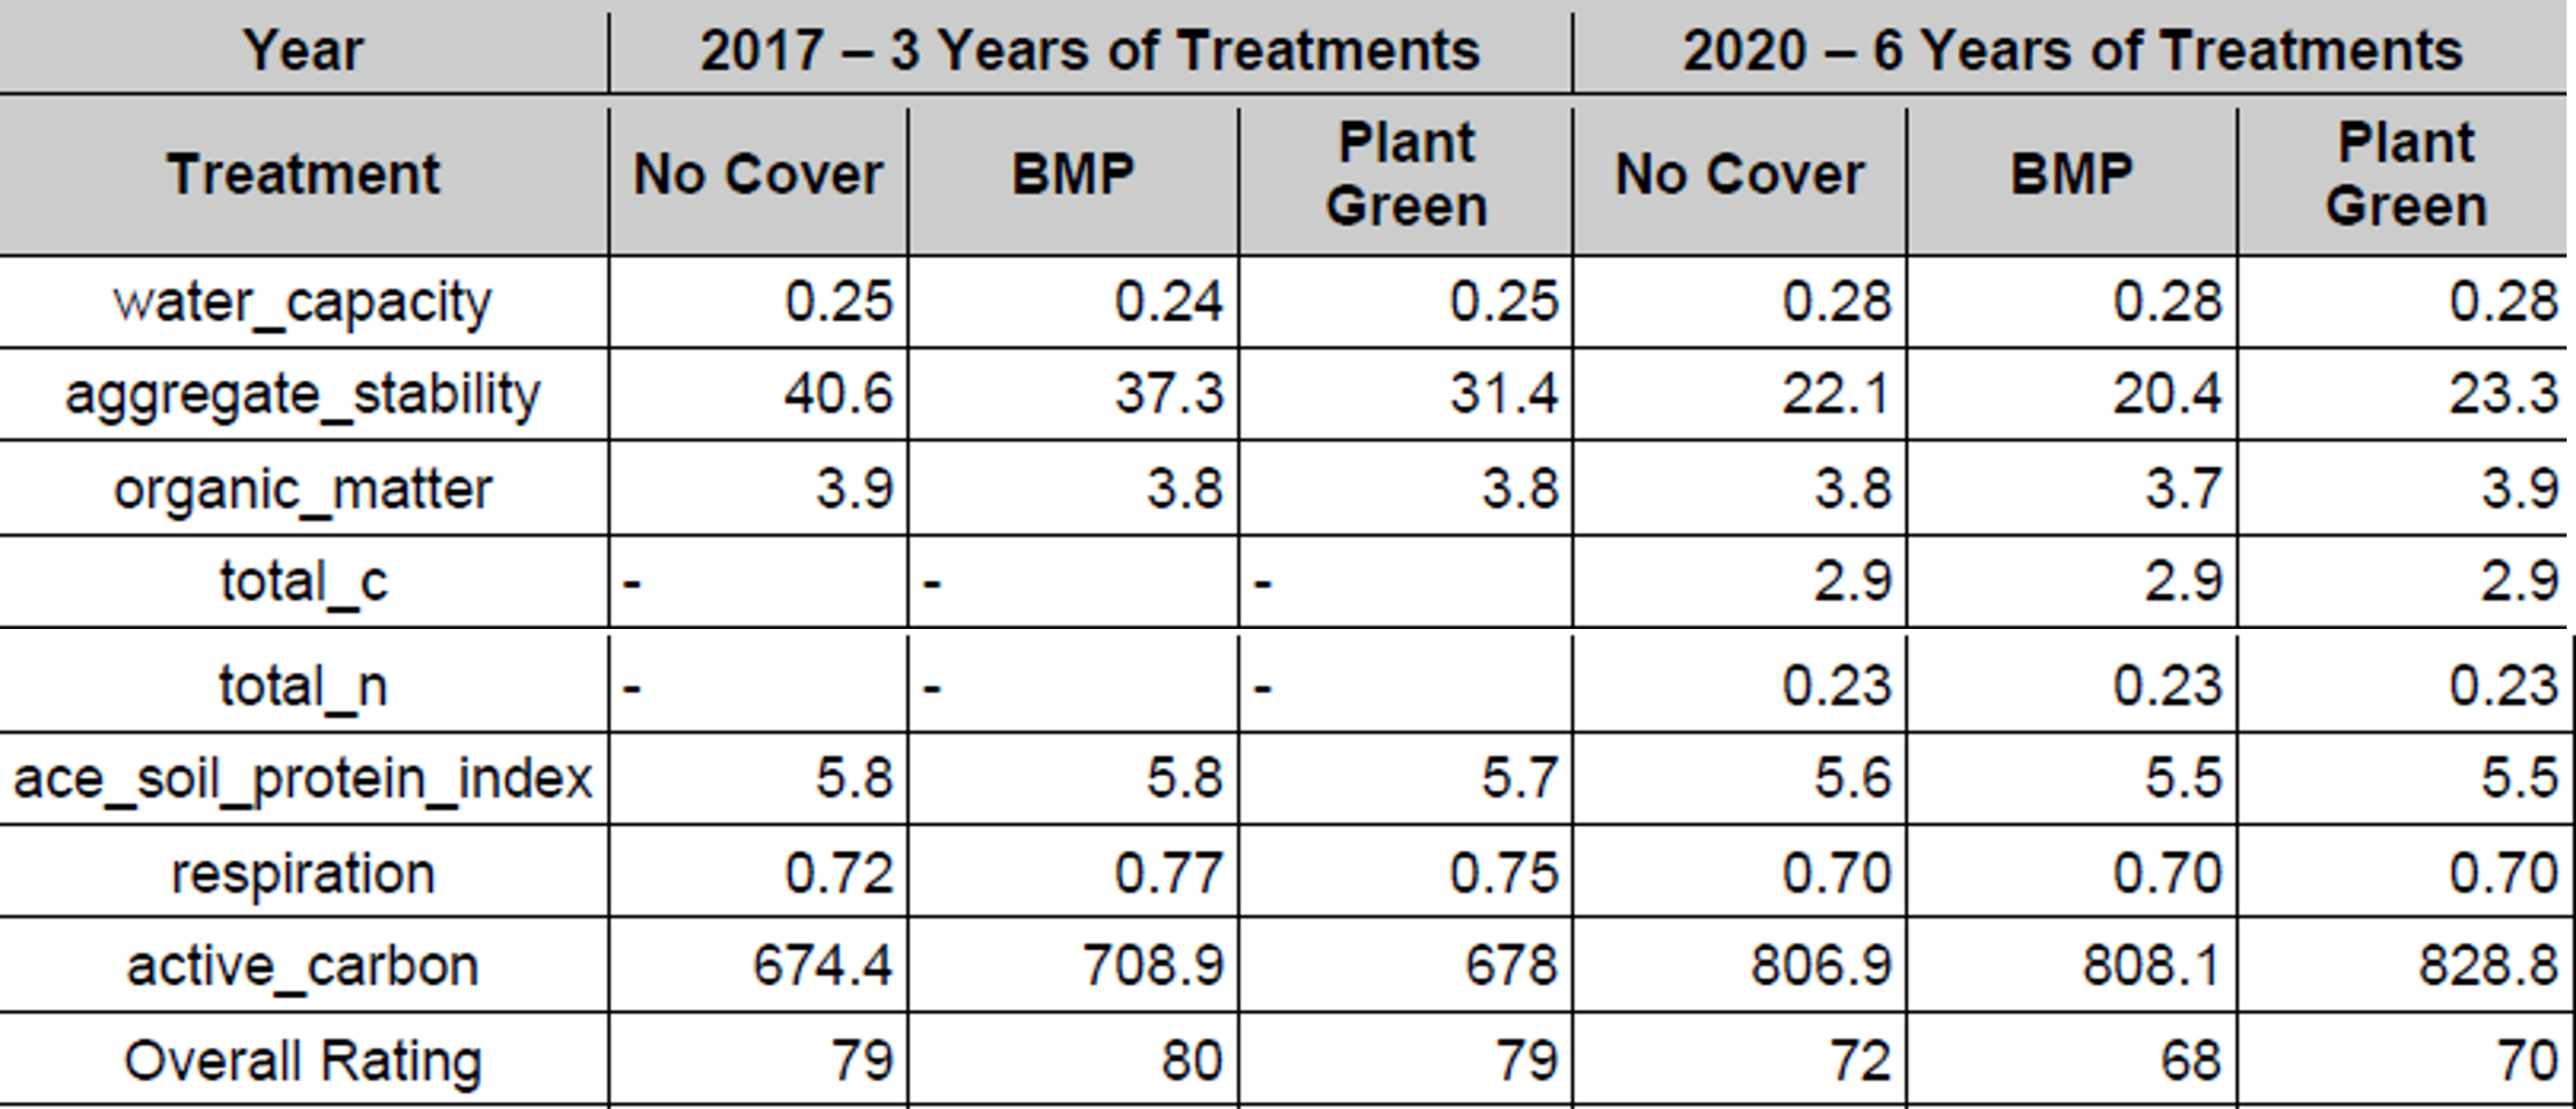
Table 15: Embro Soil Health Results
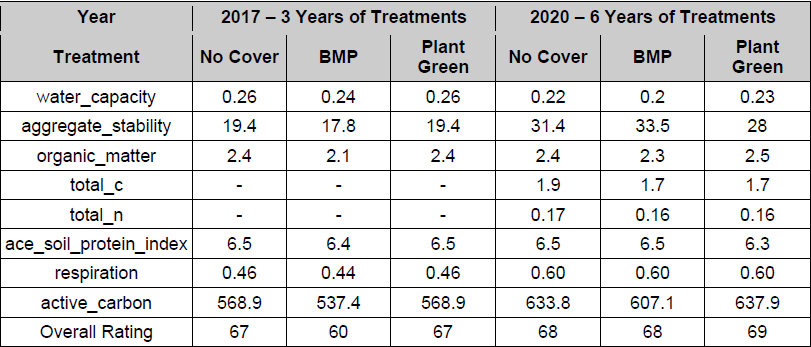
Table 16: Overall Soil Health Average of All 7 Sites
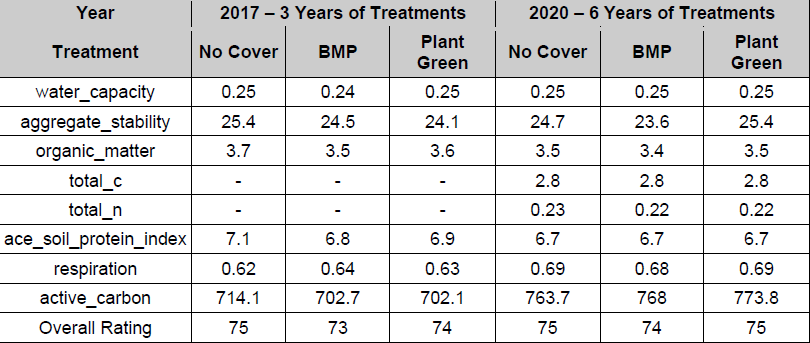
After 6 years of the roots not iron project there is still essentially no difference between the above soil health measurements. There is a lot of variability between sites but the overall data shows potentially a minor trend to higher active carbon levels with increasing cover crops but there is no statistical difference between treatments.
Summary
There was little difference in wheat yields across treatments. These findings are similar to what was seen in the first stage of this project.
On average there was very little difference in corn yield across treatments, which is a drastic improvement from the results seen in the first stage of this project where yields were reduced by 16.6 bu/ace in the plant green treatment. It was hypothesized that emerging corn plants sensing the presence of other green plants nearby caused the corn plant to alter its growth pattern, along with difficulty in getting sufficient seed/soil contact through masses of living roots. It is still unclear if the improved results are due to the introduction of strip-till, reduced greenness in the cover crop at corn emergence, improved soil health, or a combination of many factors.
From yield numbers in this project, it appears soybeans may be able to handle the stress of plant green better than corn. Soybeans suffered only minor yield loss when planted into a green cover crop. Beginning in 2019 soybeans were seeded into cereal rye instead of annual ryegrass to see if there is any improvement in yield. Initial results may indicate that cereal rye may have less of an impact on soybean establishment compared to annual ryegrass but so far spring cereal rye growth has been limited due to late fall establishment.
There has potentially been some minor improvements in soil health over the last 6 years of this project but results are still statistically insignificant and very minor.
Next Steps
2022 will be the final year for the Roots not Iron 2.0 project. During the fall of 2022 soil samples will be collected for a 3rd time from each location to compare changes in the soil health assessments (Solvita test for biological activity) and ON-CSHA (Cornell Soil Health Assessment) of each treatment.
Acknowledgements
Huge thanks to our co-operators. Thanks to administrator Marian Desjardine. Special thanks to Cathy Dibble for helping to coordinate sites and data. This project would not be possible without the support and funding of the Ontario Soil and Crop Improvement Association.
Project Contacts
Peter Johnson, Agronomist, Real Agriculture, pjohnson@realagriculture.com
Shane McClure, Research Lead, shane_mcclure@hotmail.com
Cathy Dibble, Thames Valley SCIA cathy.dibble@ontariosoilcrop.org
Location of Project Final Report:
Peter Johnson, Agronomist, Real Agriculture, pjohnson@realagriculture.com