Purpose
In the compaction recovery with cover crops tier two applied research project, we were seeking to understand the impact of cover crops in a rotation on the gradual alleviation of compaction over 2 years following a compaction event. Knowing more about the tools available to farmers to alleviate compaction is important for the same reasons that preventing compaction is important. Compaction can lead to decreased water infiltration and water holding capacity, increased soil erosion, reduced yields and nutrient uptake, increased input costs, reduced root growth and rooting depth.
Methods
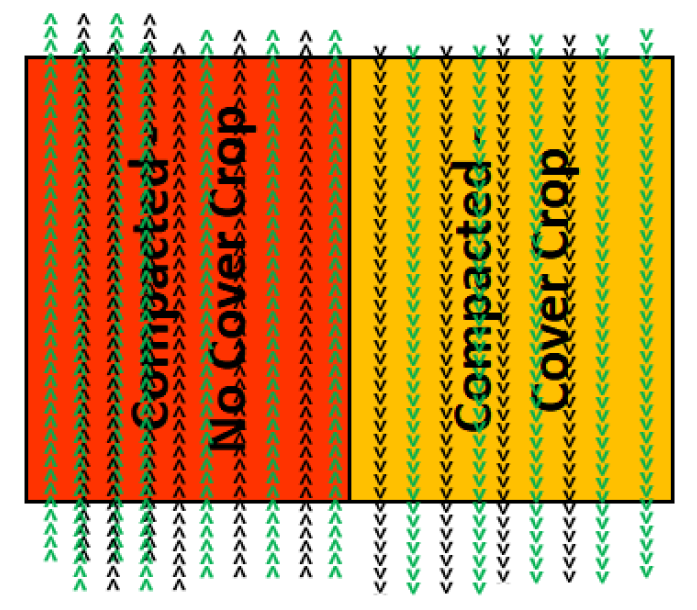
The amount of soil compaction research conducted in North America is not high. It is difficult to do and there are many variables that impact results. The project team struggled to develop a layout that would test the objective of determining if cover crops could help to alleviate the ill effects of a compaction event. Eventually it was decided that the best way to make the comparison was to create a worse case vs a best-case scenario. To do this the trials were set up with two replicates of a fully compacted area and two that had normal field traffic. As shown in figure 1 and 3, the compaction area was created by the cooperating farmers driving the compacting implement across the landscape so that the entire 60’ wide swath of the area saw at least one-wheel track.
Figure 1. Compacted Plots Trafficed Edge to Edge
While this would not be normal, it gave the most likely comparison to show a compaction effect and thus enable an easier determination of whether the added cover crop treatments worked to alleviate the compacted effect. These compacted treatments occurred on November 29th at Site A and October 3rd at site B. In both cases the winter wheat had been previously planted, so the impact of tracking on the seeded wheat above and beyond the soil compaction effect needs to be accounted for. The field conditions were ones that given the implements used, the farmer felt were too soft for timing field operations which is what the target had been set for.
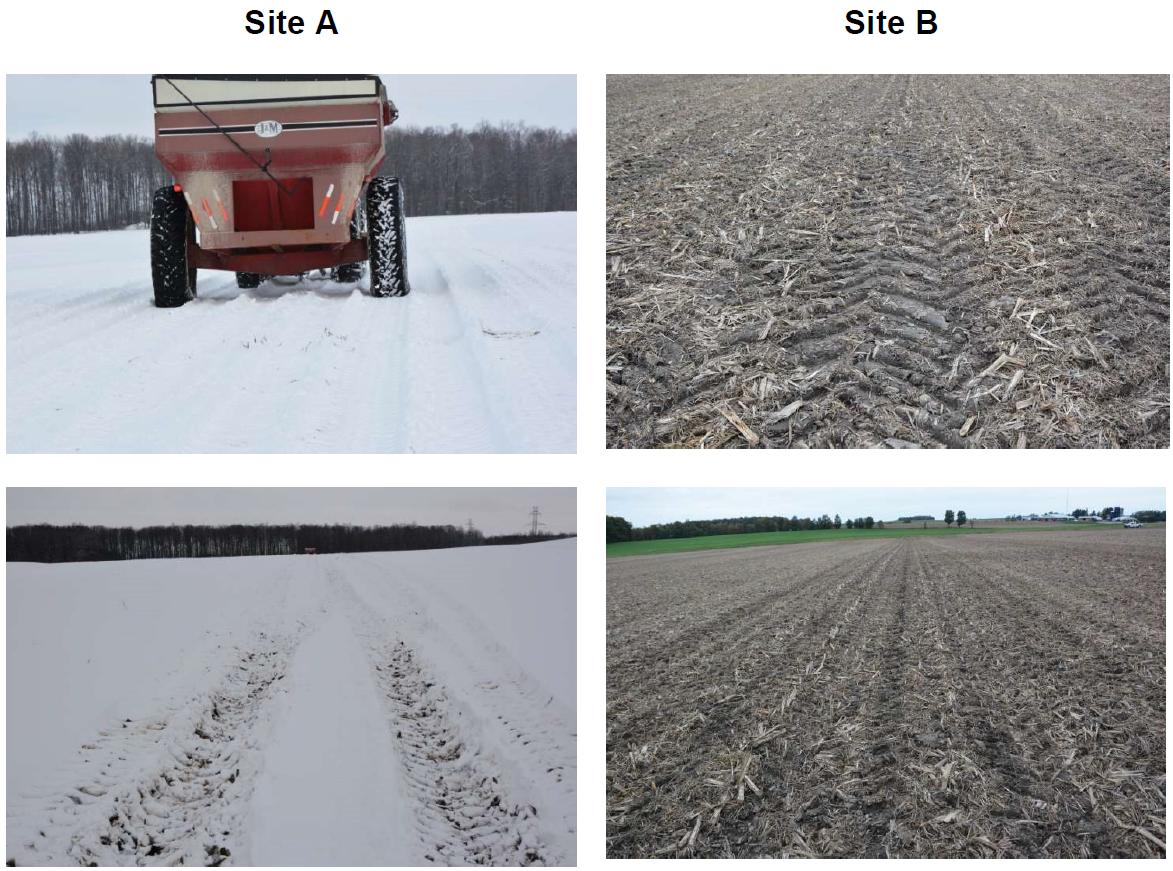
Figure 2 highlights how the compaction treatments were established and under what soil conditions.
Figure 2. Compacted treatments applied by edge to edge field traffic from weighted implements, Site A Grain Buggy, Site B Combine.
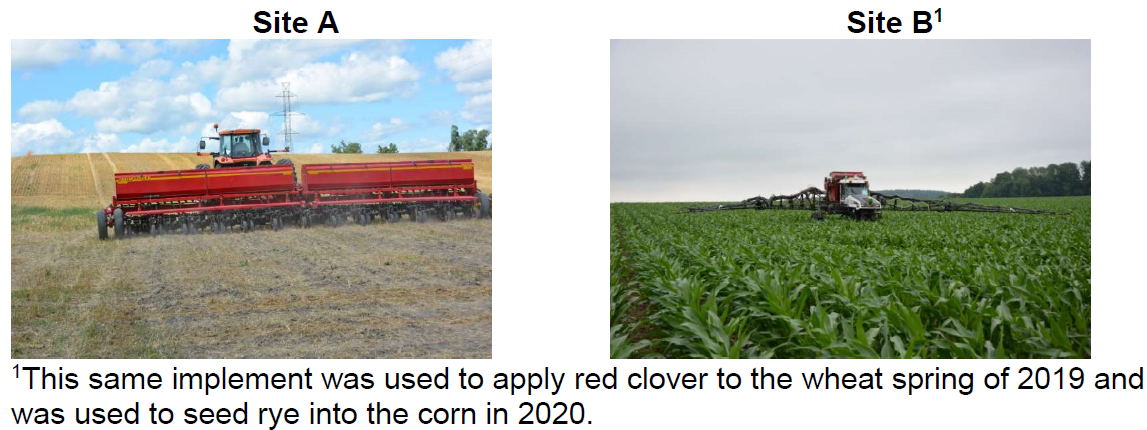
The treatments to be compared are summarized in tables 1 and 2. Cover crops were applied at Site A with a 30’ no till drill following wheat harvest (Figure 4) and at Site B with red clover using a modified Spray Coupe in early spring of 2019.
Wheat was harvested in summer 2019 and the cover crops were left to grow for the remainder of the season and observed several times.
Corn was planted in the spring of 2020 using GPS to align the planting with the previously established plots so that 12 rows of 30” corn fit in each. Through the corn season the crop stands, compaction assessment data and crop yield were collected.
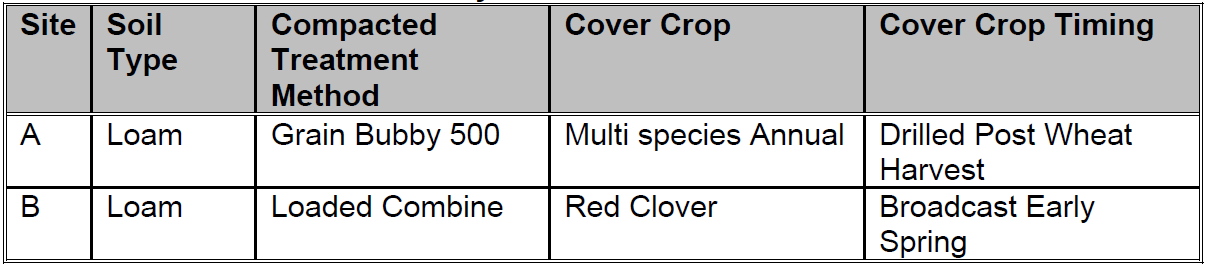
Both sites in south Bruce County were loam soil with a no till history and a rotation during the project of Soybeans (2018), Winter Wheat (2019), Corn (2020).
Table 1. Treatment Listing
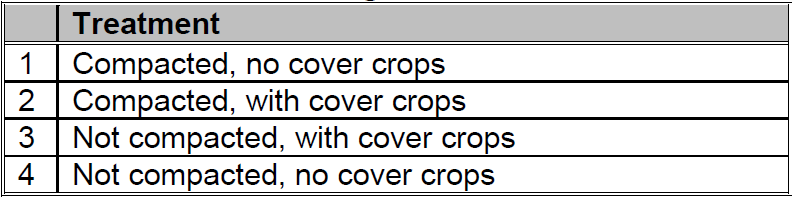
Table 2. Treatment Parameters by Location
The compaction treatment blocks in figure 3 were installed in the fall of 2018. The plots were split in the spring of 2019 to establish the cover by compaction treatments in two replicates. The modified design to have cover and no cover treatments side by side between compacted and non-compacted treatments were done to facilitate equipment movement in the plot area.
Figure 3. Final Field Plan for sites.
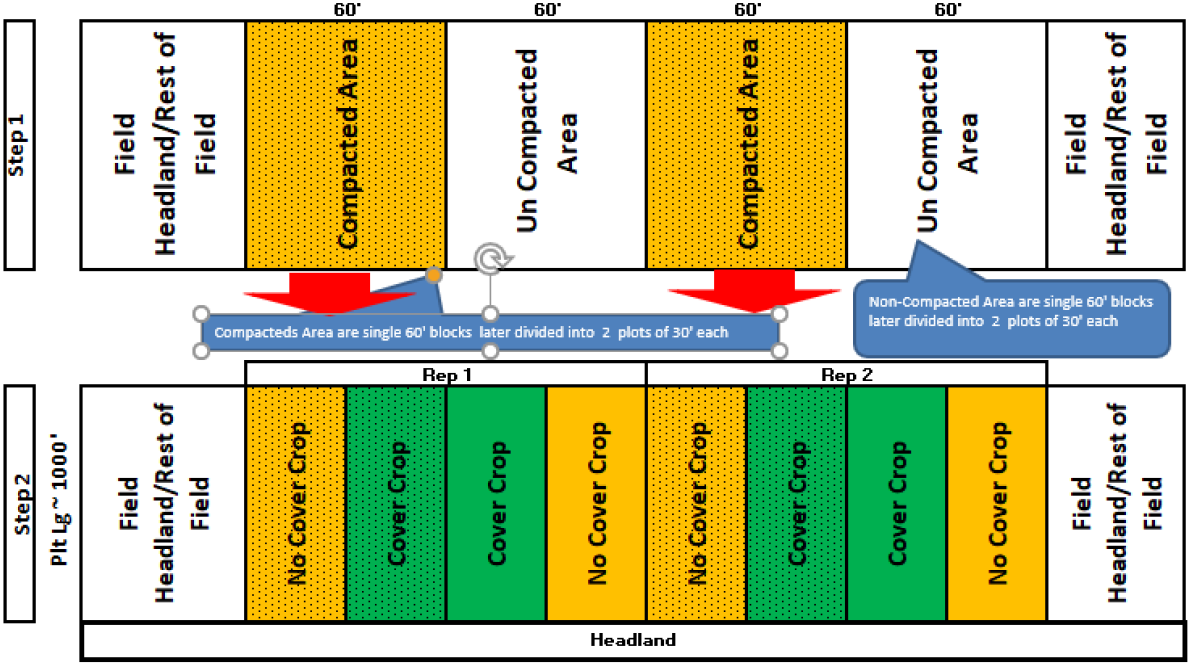
Figure 4. Method of cover crop establishment into the wheat ground
Finally, samples were extracted to be analyzed at The Canadian Light Source, Canada’s national synchrotron light source facility in Manitoba by the Heck Laboratory at the University of Guelph to further validate and provide some qualitative analysis to augment the penetrologger data (awaiting results).
Results
In the spring of 2019, the winter wheat was assessed for visual differences in the wheat stand. While early spring there were differences observed as shown in figure 5, the differences were attributed to the machinery trampling effect on the newly seeded wheat in the fall of 2018 compared to the effect of the soil compaction itself. This was most evident at Site B since the trampling occurred shortly after the wheat planting date. At Site A, the compaction installation timing was 2.5 months after seeding and somewhat insulated by the snow layer.
Figure 5. Visual effects of compaction treatments on the wheat Site B
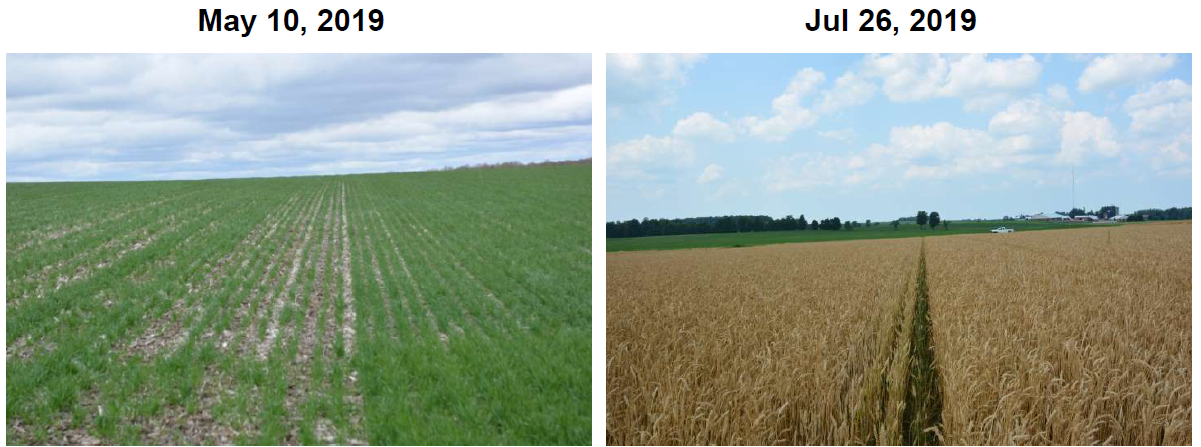
Figure 6. Conditions at wheat harvest. Site A, cover crops yet to be planted, Site A, red clover visible coming below the wheat canopy.
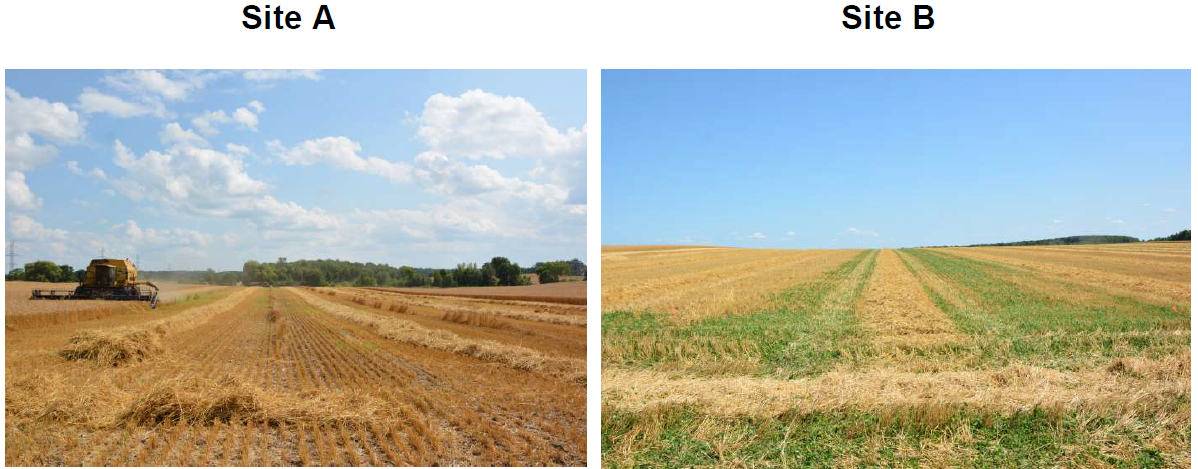
Site B with the red clover seeded early spring had an excellent catch relatively consistent throughout the cover crop plots.
Figure 7. Cover crop biomass evident in cover crop plots (top) verses cover from weeds or volunteer wheat in non cover-crop treatments (bottom) Nov 26, 2019.
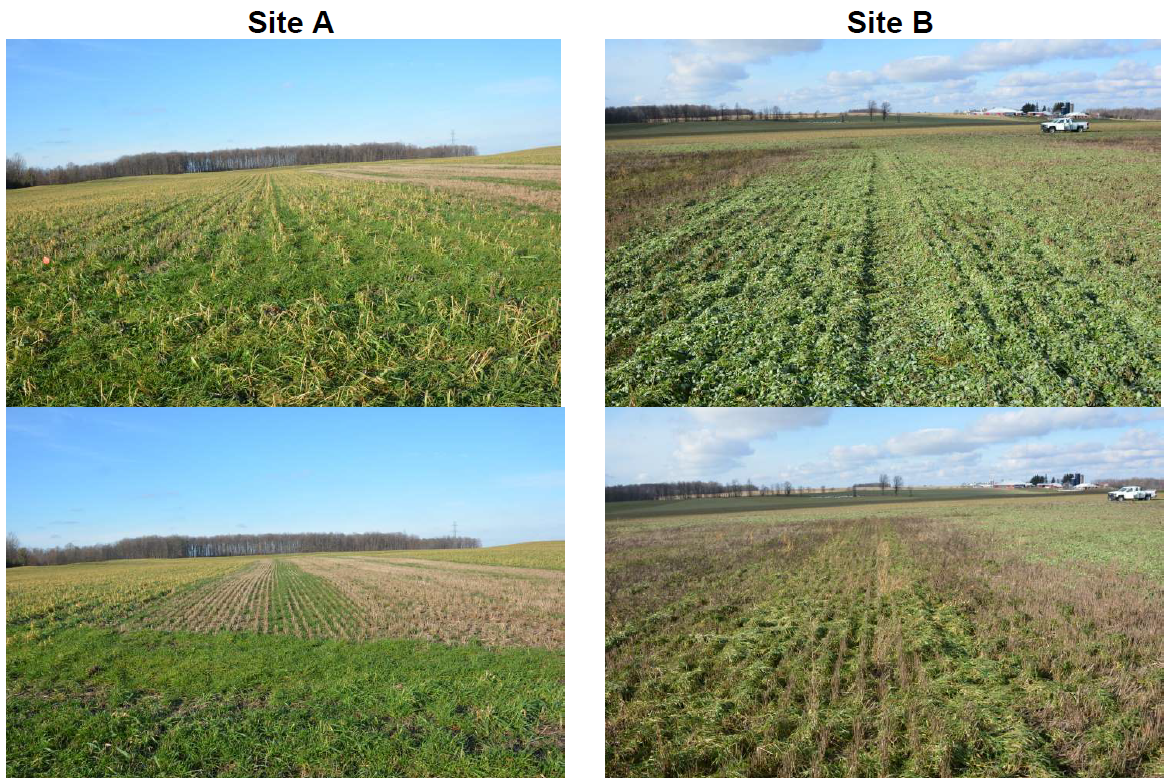
Cover crop left to grow following wheat harvest grew rapidly. By late fall there was good cover biomass in the cover crop plots at both sites (Figure 7). At Site A very little weeds grew in the non-cover crop plots except for some volunteer winter wheat. It was surprising to see the amount of weed growth that came in the non-cover crop plots at Site B. Essentially the entire non-cover crop plot area was completely covered by a relatively uniform distribution of weeds, which while not desirable, does offer ground cover and rooting that could be addressing compaction in the appropriate plots.
Crop yields were collected for winter wheat in 2019 and corn in 2020. No significant differences in crop yield were observed for either crop between compacted vs non compacted or with the cover crop treatments overlaid on the compaction plots.
Table 3. Crop Yields by compaction and cover crop treatments for 2019 and 2020.
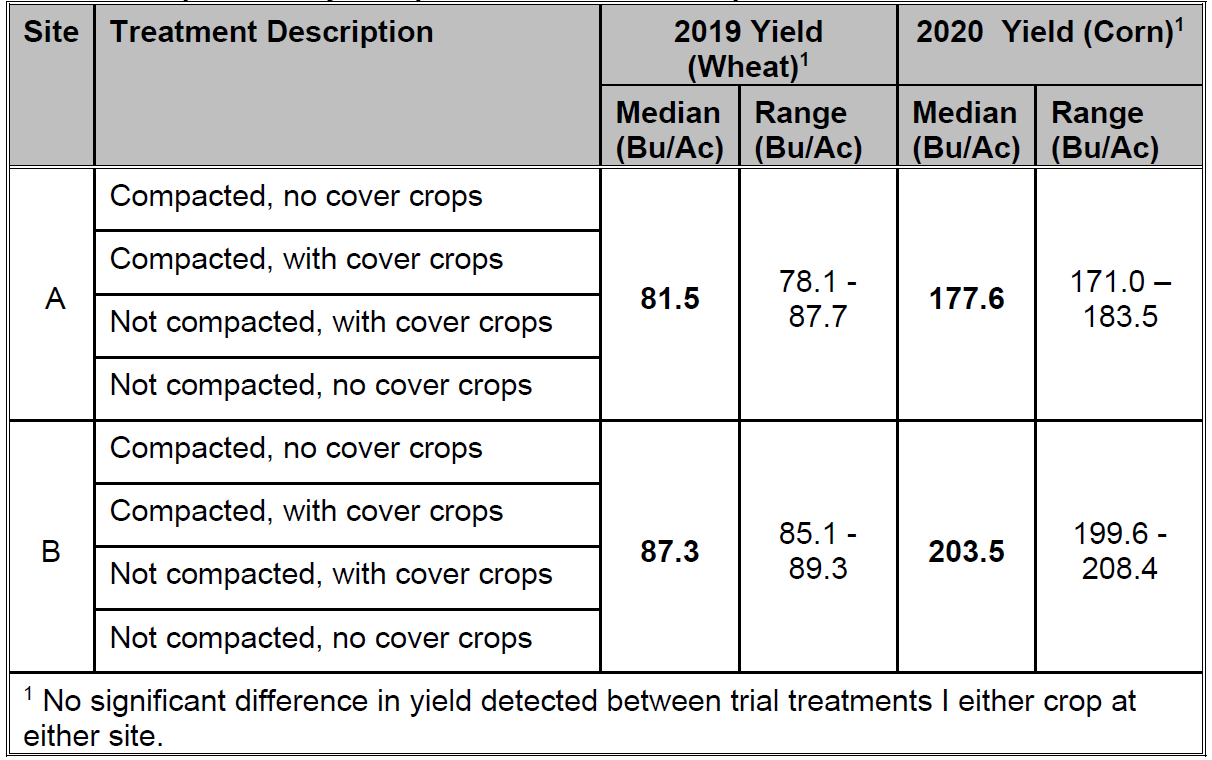
Table 4. 2020 Corn plant stands mid-June.
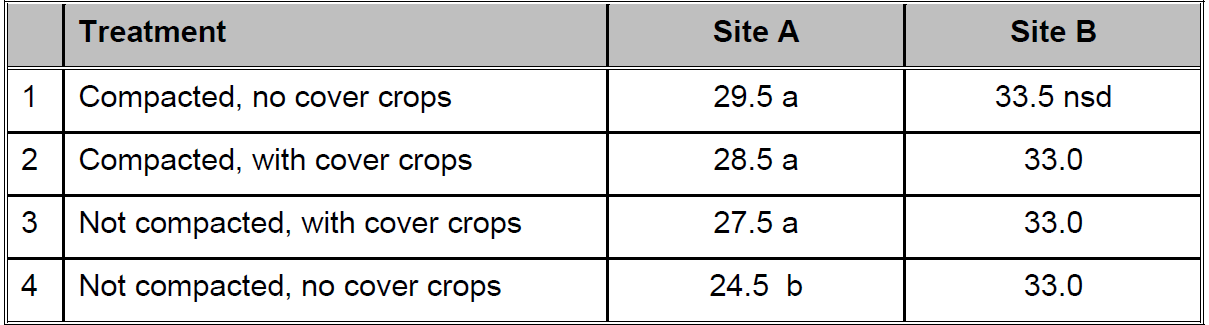
Corn stands assessed in early June of 2020 showed little significant differences. At Site B no significant differences were detected at all. At Site A the emergence was not as good as expected overall with the spring conditions. The single treatment of not compacted with no cover crop had a significantly lower stand than the other treatments. There was no obvious reason why this should be so.
Soil compaction assessment data was collected using a hand penetrometer. This was a significantly sophisticated tool compared to the ones often used by farmers and advisors. It would instruct the operator on the speed to insert the prove and would gather numeric and observational data at 1cm increments to a maximum depth of 80cm. As with many scientific instruments its build ruggedness was rather tenuous.
Sampling was attempted at various times but field conditions being too wet and not picking up readings or too dry and not allowing suitable consistent penetration either at all or at an insertion speed that was reasonable were hard to come by. An assessment was finally completed on Jun 20th and Jun 5th for Sites A and B respectively.
Figure 8. Penetrometer mapping of the treatments by site.
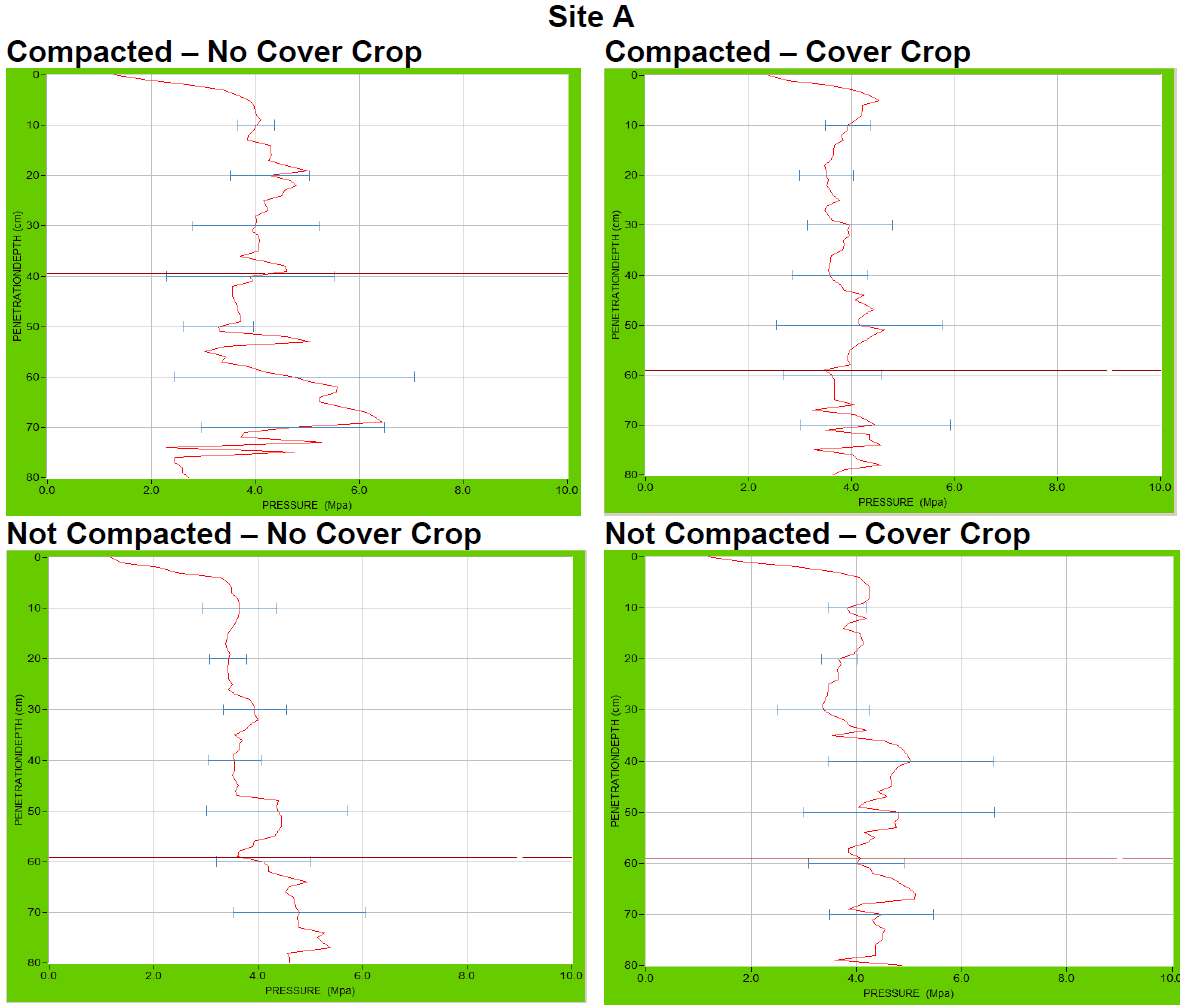
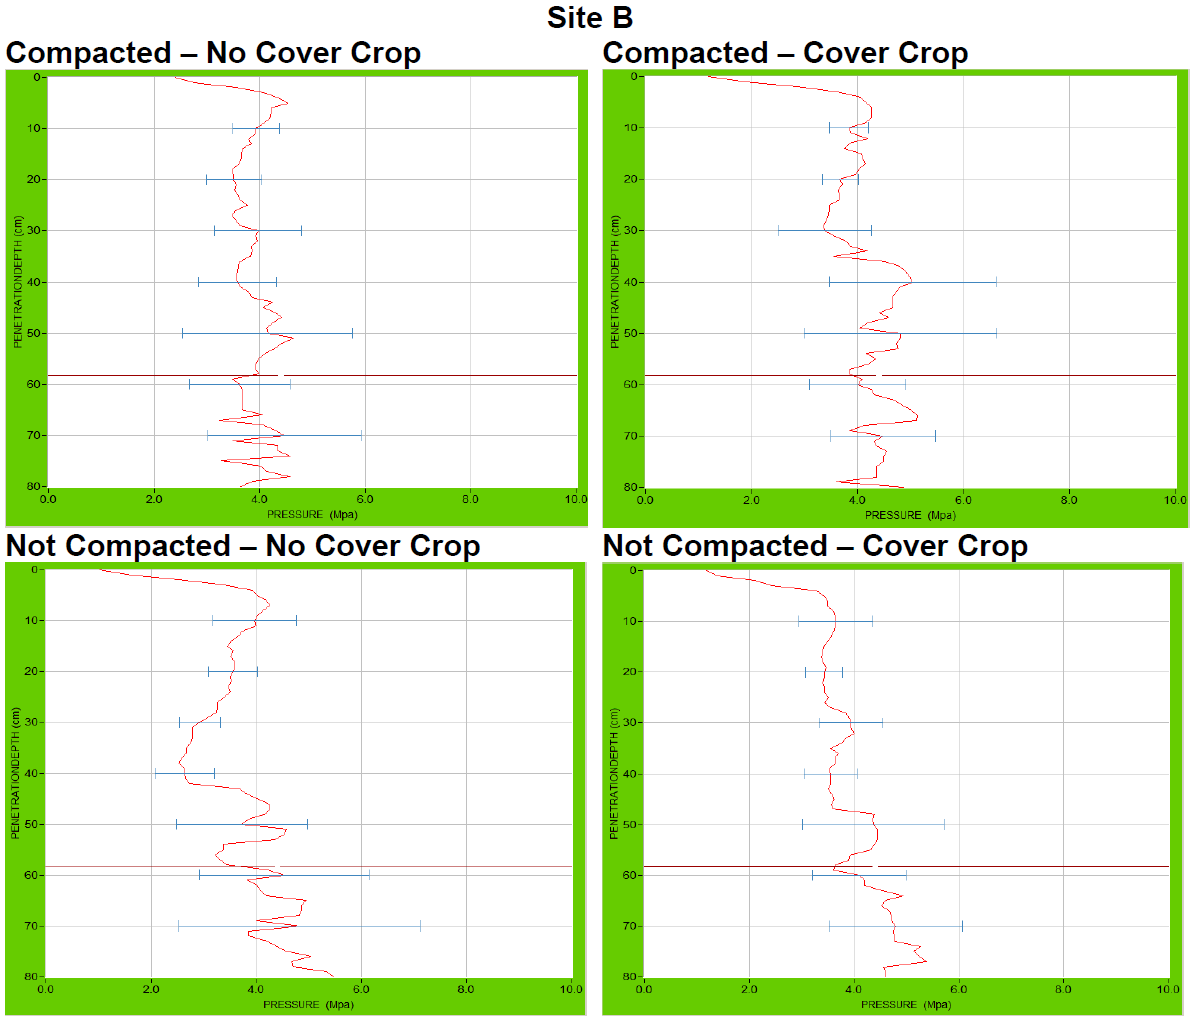
The red lines in each plot are the average pressure detected by depth across 5 probing’s per treatment. The blue lines indicate the range of variability over the 5 probing’s. The path of the line shows the resistance detected at each 1cm depth increment. In general, the maps do not show distinct major observable differences in the pressure (Compaction) by depth across the treatments.
Summary
Our findings with the compaction trials led us to observe more pertaining to the prevention of compaction, than the alleviation of it. We were also able to experience first-hand the challenges of measuring compaction. Without being able to adequately measure soil compaction and its impact on various soil and yield components it is difficult to predict and monitor it.
The penetrologgers were chosen because they measure soil strength. Soil strength is a strong indicator of susceptibility to compaction and can also reveal if a soil has undergone compaction. While measuring load, pressure, soil moisture or soil texture would be good predictive factors for compaction, they do not measure soil compaction directly. Much like when we call something “heavy” when other people would not; calling loads “compactive” before the soil has been compacted skews our expectations and limits our ability to make good decisions. It is important to understand the factors contributing to soil compaction as a function of the results, not just the risks.
The penetrologgers selected were the best equipment available within the applicable price-range and proved to have constraints severely limiting their utility. The GPS, mapping and data interpretation capabilities were strong features for producing great data sets. The feedback mechanisms were still not useful in allowing a wide range of users to effectively operate the penetrologgers and no number of statistical corrections could accommodate for the combination of rocks and cracks that we see in agricultural soils.
Our strongest finding is that regardless of the load and soil conditions under which one would reasonably predict compaction is taking place, compaction does not appear to have taken place in these no-till trials. Unfortunately, we had not successfully installed the compaction trial plan in tilled fields for comparison. Thus, we are left to conclude that since compaction did not appear to happen in these no-till fields, the value of cover crops at alleviating soil compaction could not be determined. Given that the farmers who installed the compaction treatments felt that the soil conditions at the time of installation were too wet as was the protocol, we must conclude that no-till systems are more resilient to soil compaction. The thinking is that soil compaction would have occurred if the same moisture conditions were present in tilled fields when the compaction was installed. However, without these comparisons we are unable to make this conclusion.
Next Steps
This work was challenging because of the nature of soil compaction work in terms of the variability of soils within and between different fields. The other important variable to doing this type of trial is the time commitment needed over a minimum of 3 years on each site and the ability to keep the integrity of the individual plots intact. GPS was used to do this but still had its failings.
Since no no-till vs tilled site comparisons were collected, we remain unable to answer whether more soil compaction would have occurred had soil been tilled. Even with no-till the lack of more sites for which to compare the results is problematic.
This project should be repeated to gather knowledge on the impact of soil compaction by tillage system and to understand the ability of cover crops to help alleviate soil compaction once it has occurred.
Acknowledgements
Bruce Soil and Crop Improvement Association along with the cooperating farmers should be acknowledged for taking on this project. Its implementation while appearing simple requires a lot of thought and dedication to seeing it through. This is primarily because of the longevity required of maintaining each site over a minimum of 3 years and keeping all the components straight.
The funding by an OSCIA Tier2 grant that supported this effort and to Saugeen Conservation Authority for helping to manage the project were greatly appreciated.
Project Contacts:
Tori Waugh, Projects Coordiator, Saugeen CA, tori@cag-c.com
Ian McDonald, Crop Innovation Specialist, OMAFRA, Ian.mcdonald@ontario.ca