Purpose
Water extractable phosphorus (WEP) in manure has been linked to dissolved P in runoff from organic amendment/manure-amended soils. A 2001 study (Withers et. al.) found that concentrations of dissolved P in runoff from soils amended with mineral fertilizer, cattle manure and biosolids were proportional to the concentration of WEP in the different amendments.
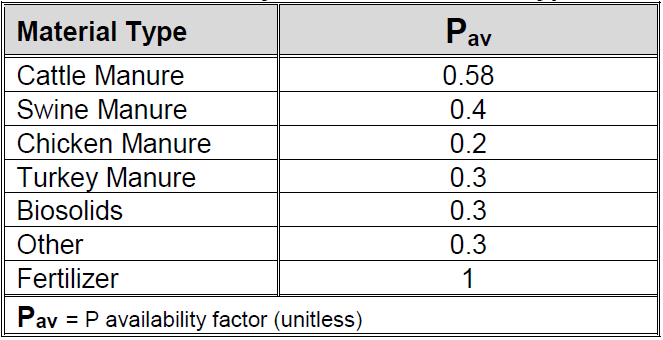
Ontario has developed the Phosphorus Loss Assessment Tool for Ontario (PLATO) to assess the risk of phosphorus loss on agricultural landscapes. A previous version of this tool was known as the Phosphorus Index, the tool looks at erosion risk, phosphorus fertility levels, tile drainage, fertilizer timing, rate and placement and use of organic amendments timing, rate and placement. Risk is highest when organic amendments with high water extractable phosphorus is surface applied on bare soil where fertility levels are high and risk of erosion is high. PLATO is populated with the most current available data, including the availability of phosphorus for various species of livestock Table 1 shows the factors currently used in PLATO to predict risk of phosphorus movement from surface applied amendments, and shows cattle with the highest risk and poultry with the lowest risk. Livestock producers, especially beef producers questioned that the manure from their livestock, especially solid manure, could be higher risk than swine manure or poultry manure. Did the type of storage – liquid vs solid, or type of bedding or even ration differences such as corn versus pasture-fed change the proportion of water extractable phosphorus in the manure?
Table 1. P Availability Based on Material Type
Data used to predict the risk of phosphorus loss from livestock manure and other organic amendments is currently sourced from the USA. In the 2018 Canada-Ontario Lake Erie Action Plan, Ontario committed to “continue to conduct research to improve modelling capability to quantify phosphorus reductions from BMPs at a landscape scale.” This project (BMPVD 2017/18 – WEP01) attempted to verify and fine-tune the water extractable phosphorus data from manure using samples taken from a variety of Ontario livestock farms and from commonly used municipally-sourced organic amendments. The US data does not include all livestock species (e.g., sheep), different treatment systems (e.g., composting or anaerobic digestion) or municipally sourced organic amendments (e.g., processed biosolids). This project was initiated to verify the US information with Ontario data and determine, if possible, what factors affect phosphorus availability.
Methods
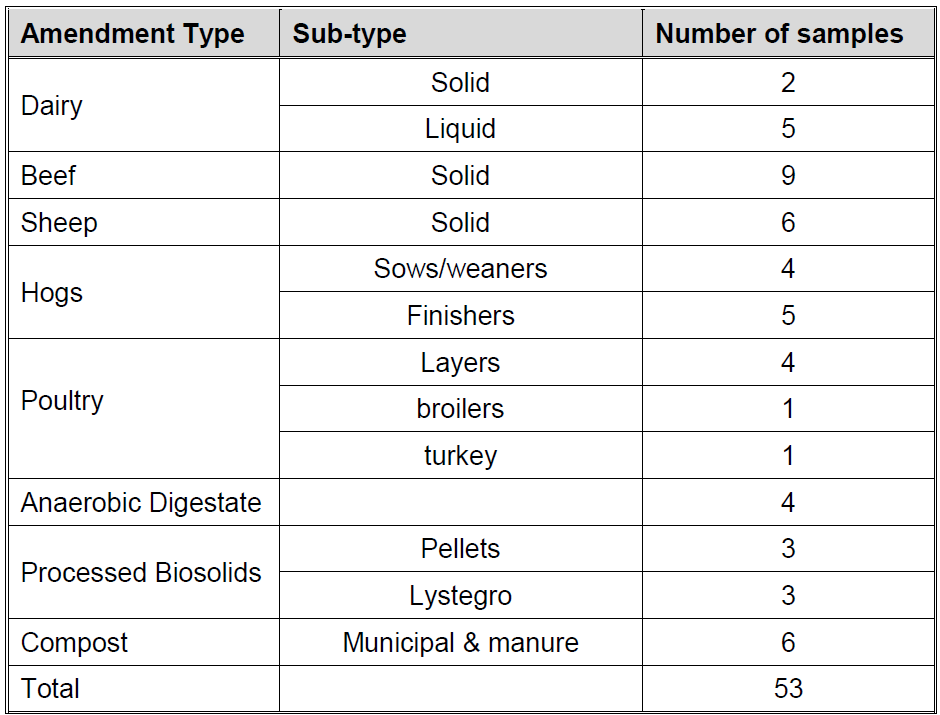
Fifty one (51) samples of manure and organic amendments were sampled between November 2017 and June 8, 2018 to determine variability and how composition influences WEP, and how the samples compared to the US data used in PLATO. Table 2 gives the breakdown of the livestock groups and subgroups that were sampled as well as other types of organic amendments sampled. In a few cases, several samples were taken from the same facility, but from different livestock grouping or storage or treatment systems. This was done to try and understand what ration or management practices influences the WEP portion of the total phosphorus.
Samples were analyzed by A&L Laboratories (London) for complete analysis, including macro and micro nutrient profile as well as organic matter, C:N ratio, pH, total salts, bulk density and water extractable phosphorus.
Water-extractable phosphorus analysis followed the same methodology used for the 2005 survey completed in the US by P Kleinman et al. Water extractable phosphorus was analyzed on fresh samples with a dry matter/solution ratio of 1:200 and a shaking time of 1 hr. Following centrifugation (1000 x g), extractable P was determined by inductively coupled plasma spectrometer (ICP).
Table 2. Breakdown of Samples for WEP Analysis
Comparisons were made of WEP and to the portion that WEP represented of the total phosphorus in the sample. A typical application rate (based on nutrient content spring applied to a corn crop) was calculated for each sample to determine how much actual WEP was applied so that risk can be assessed considering both concentration and rate for various livestock species.
Results
Sample data was compared to the US study by P. Kleinman et al (Survey of Water-Extractable Phosphorus in Livestock Manure P Kleinman, Soil Science of America Journal 69:701-708 (2005)) The data was compared in hopes of verifying the P availability values used in PLUTO and better understanding what factors influence WEP. Finding trends based on composition, including total phosphorus, nitrogen, dry matter levels and micro nutrients levels – particularly calcium, iron, aluminum electrical conductivity (total salts) and organic matter would help to fine-tune additional sampling.
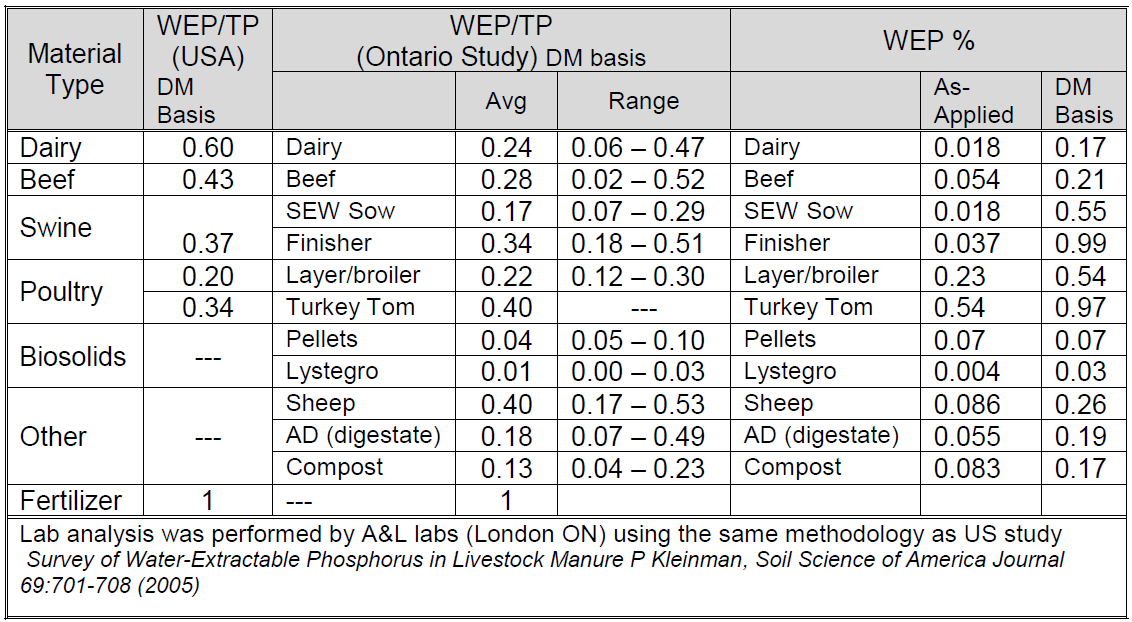
Table 3 shows the phosphorus availability based on the material type for the Ontario data. Sample information was averaged by livestock type and in the case of swine and poultry also by subtype. Note that the sample size for some of the organic amendments is small. Percent water extractable phosphorus is shown on an as-applied basis and on a dry matter basis to help compare material concentrations on an apples-to-apples basis. Water extractable phosphorus was also compared to the total phosphorus in the sample to determine what percentage of the total phosphorus was WEP and how that differed among organic amendment types. The average value and the range was reported to show the variation in sample results
Table 3. Phosphorus Availability Based on Material Type
Summary
The Ontario data was compared to the US data by taking the actual lab analyses and comparing the WEP as a proportion of the total phosphorus in the sample and also comparing pH and some of the micro nutrients to look for patterns or similarities. The WEP/Total P data for finisher hogs and for poultry were similar while that same comparison for both beef and dairy cattle indicated much higher proportion of water extractable phosphorus in US manure samples than from those collected in Ontario for this study. There were no dairy samples in the Ontario study that were at the level of the US average. The next step to this study will be to determine what practices in dairy and beef production leads to the difference in water extractable phosphorus.
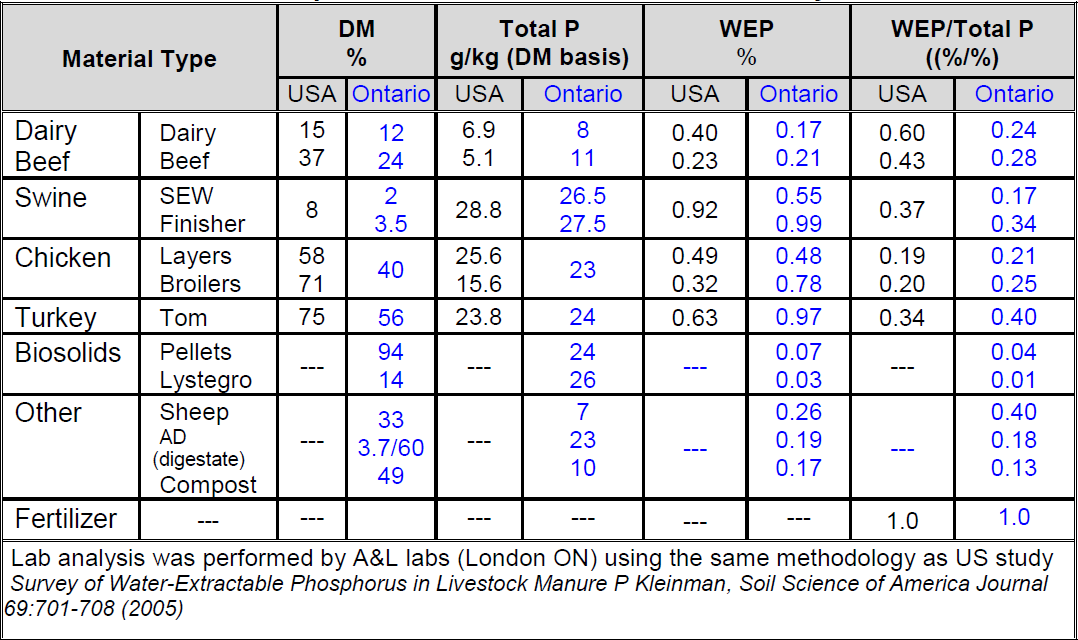
Table 4 compares the US data used in the phosphorus loss assessment tool (PLATO) with the Ontario data and compares the WEP, the Total P, and the WEP as a portion of total P. It also compares a few of the micro nutrients, calcium (Ca), magnesium (Mg), aluminum (Al), iron (Fe) and pH, which are known to affect phosphorus availability.
Table 4: Nutrient Comparison – USA Data Vs Ontario Study Data
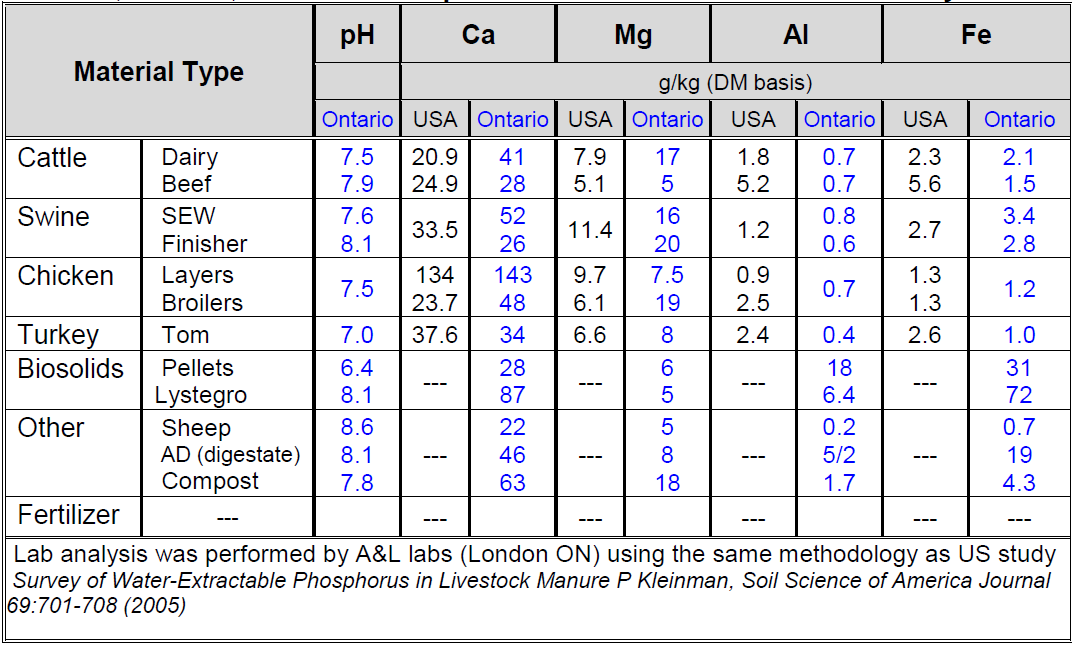
In the US study, there were correlations by livestock type, storage system and dry matter content. There were varying correlations observed between WEP and micro nutrients.
In the Ontario study, the sow (swine) manure had half the WEP/Total P concentration of finisher hogs, but a significantly higher (double) calcium content in the manure composition. The pH levels in the manure samples seemed closely correlated to the calcium content. This was also evident in comparing some of the other organic amendment groups.
Also of interest was the processed biosolids, (Lystegro and biosolids pellets), which had almost none of the phosphorus as water extractable. The Lystegro material goes through a “lysing” process and has potassium hydroxide added. All of the processed biosolid materials have high levels (or combinations of) some nutrients/micronutrients
(aluminum, calcium, iron and/or sulphur) as well as high pH.
Next Steps
- Share information with the producers that provided the samples
- Collect additional follow-up data from the sample providers for nutrient ration, approximate amount and type of bedding and use of DDG’s and/or phytase, pH of barn water, treatment process, storage type and method and any other insight to manure composition that could affect interaction with phosphorus
- Post analysis of the additional bedding and ration data from the samples collected, additional samples may be required to fill in information gaps
- Potentially sample additional farms/organic amendments (not sampled in this study) to increase sample size and verify factors (i.e. relationship to calcium) that appear to impact WEP
Acknowledgements
This project (BMPVD 2017/18 – WEP01) was made possible and carried out through Best Management Practices Verification and Demonstration (BMPVD) funding. It would not have been possible without the help listed below.
- Producers (livestock and municipal organic amendments) that provided the samples for this study
- A&L laboratories for providing analysis using US study methodology
- Keith Reid – Soil Scientist AAFC Guelph
Project Contacts:
Christine Brown – Field Crop Sustainability Specialist – OMAFRA - christine.brown1@ontario.ca