Background
Ontario Soil and Crop Improvement Association members in Oxford and Elgin Counties were interested in evaluating the impact of foliar fungicide and/or insecticide applications near corn tassel or silking timing on reducing deoxynivalenol (DON) levels in grain corn. DON, also commonly referred to as vomitoxin, is a mycotoxin produced by Gibberella ear rot. Some foliar fungicides are labelled for suppression of Gibberella ear rot, while insecticide applications targeting Western Bean Cutworm (WBC) may reduce ear feeding injury which predispose ears to greater ear mould infection risk.
Methods
Field trials were conducted in 2017 and 2018. Growers were free to apply product(s) of their choice. Six and seven corn fields were evaluated in 2017 and 2018 respectively (Table 1). Co-operators applying a tassel or silk time fungicide and/or insecticide left check strip(s) where no applications were made, allowing for a comparison of ear feeding incidence (% of ears with ear mould feeding), ear mould incidence (% of ears with ear mould symptoms, 2018 only) and DON levels under treated and untreated practices in their fields.
Just prior to harvest, treated and untreated strips were visually evaluated for the presence of ear feeding injury and ear moulds. Where untreated strips were replicated, each untreated strip and a bordering treated strip were used as plots for each replicate. Where untreated checks were not replicated (ie. split field applications), neighbouring treated and untreated strips were each divided into two subsample plots. A total of 100 ears were evaluated in each plot (10 consecutive ears in 10 random locations along length of plot). A subsample of 20 (2017) or 50 (2018) ears from each assessment were randomly collected, dried, shelled and submitted for DON analysis. In 2018, grain samples were ground using a Romer Series II Mill (Figure 1) which simultaneously grinds and sub samples to increase the probability that sub samples collected for laboratory analysis were representative of the original sample.
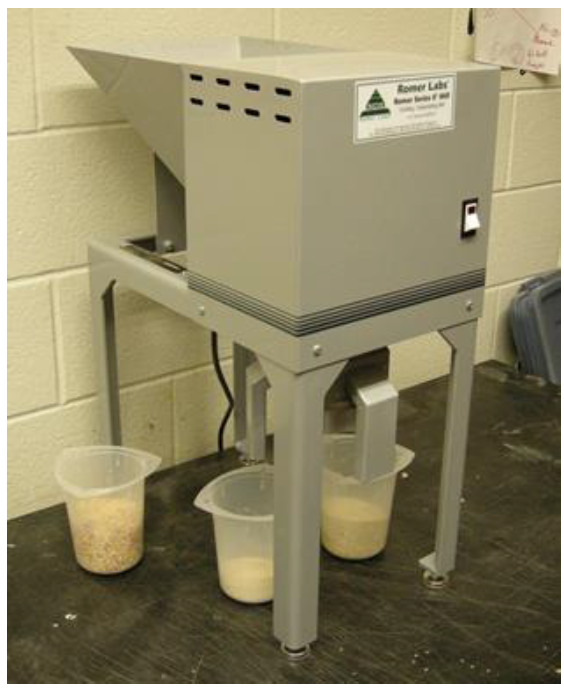
Figure 1. Romer Series II Mill used for simultaneous grinding and subsampling of shelled corn samples.
Results
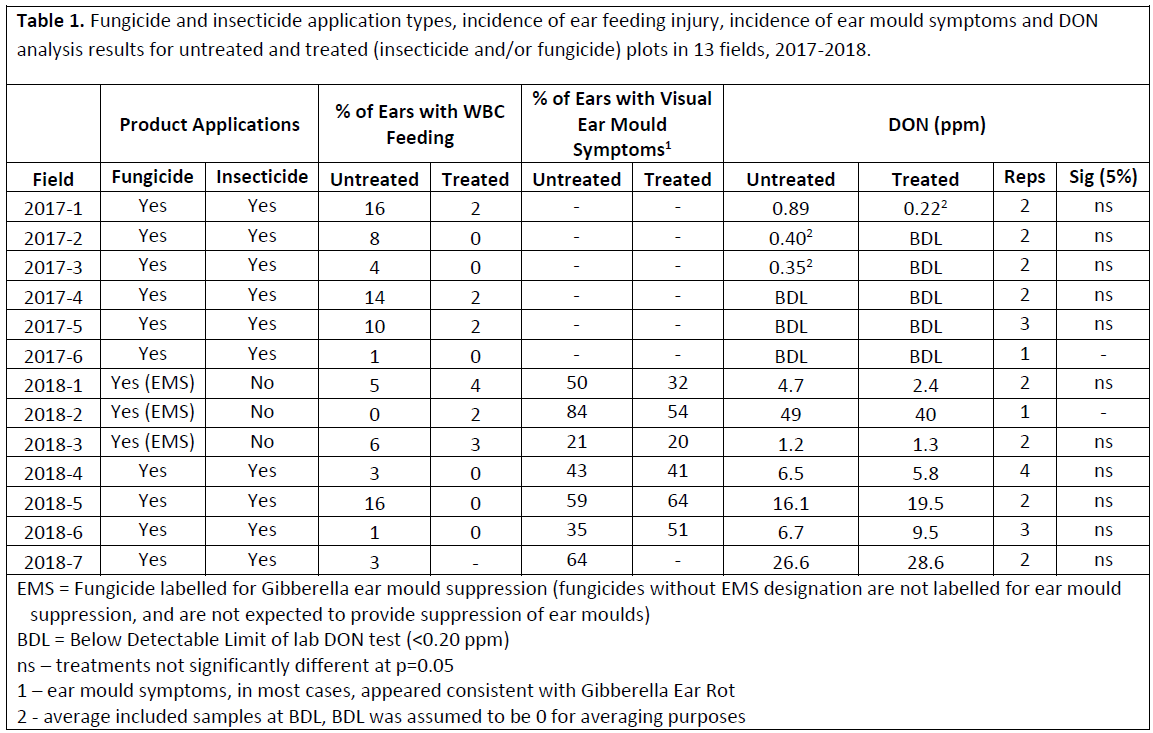
The amount of ear feeding varied by field, ranging from 1-16% of ears in the untreated control plots having some feeding damage (Table 1). In most cases, feeding damage was minor and limited to a small number of kernels at the ear tips (Figure 2). In fields with a higher incidence of feeding (Fields 2017-1 and 2017-4), a portion of affected ears also showed elevated levels of feeding damage such as side entry holes and feeding. The fungicide + insecticide application appeared to reduce feeding damage at fields where feeding was present in the untreated plots.
From a visual ear mould perspective, most fields appeared relatively clean with the exception of Field 2017-1 where some ear mould was evident (Figure 3). DON levels were relatively low across the six fields evaluated in 2017, with all samples testing below 2.00 ppm (Table 1). In the three fields where the control plots tested positive for DON, the fungicide + insecticide applications appeared to reduce DON levels. In the remaining three fields, both the treated and untreated plots were below the detectable limit of DON analysis (<0.2 ppm). None of the fungicides applied in 2017 were labelled for ear mould suppression, so any DON reductions observed for treated plots would be expected to be from reduced ear feeding injury from the insecticide application, not from fungicide activity. Despite ear feeding injury in these fields, environmental conditions in 2017 appeared to limit ear moulds or DON accumulation.
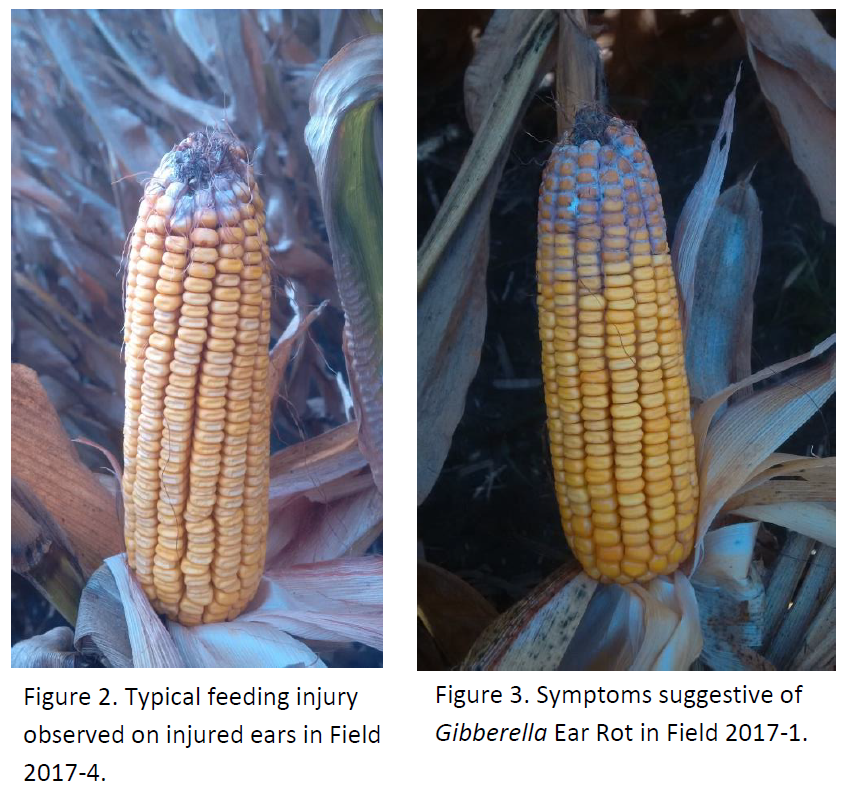
Ear feeding injury was present at very low levels (6% incidence or less) in untreated plots in most fields with the exception of 2018-5 where 16% of ears had feeding injury. Like 2017, where feeding damage was present, it was generally limited to a small amount of kernel feeding at the ear tips (Figure 2). In fields where an insecticide was applied (2018-4 to 2018-7), little to no ear feeding was observed in the treated plots (Table 1).
Ear moulds and DON were much more apparent in 2018 than 2017, with average DON values of untreated plots ranging from 1.2 to 49 ppm. Statistical analysis demonstrated no significant difference in DON levels between treated and untreated plots in 2018 fields (Table 1). While there was variability of DON levels within treatments, this may also be due to lack of statistical power from little replication at many fields. A general reduction in DON was observed in 2 of the 3 fields where only a fungicide labelled for ear mould suppression was applied (fields 2018-1 to 2018-3, Table 1). While not statistical, reductions were consistent with reduced incidence of ear mould for the treated plots in those fields.
Little reduction in incidence of ear mould or DON was observed in the remainder of 2018 fields (Table 1). Given the fact that the fungicides applied in these fields are not labelled for ear mould suppression, any DON reduction would be expected to be from reduced ear mould from reduced ear feeding from the insecticide applications. The lack of reduction in DON from insecticide applications likely reflects the fact ear feeding injury in untreated plots was generally low in these fields in 2018.
Summary
Where Gibberella ear mould pressure is present, fungicides labelled for Gibberella ear mould suppression applied at the proper time may help in reducing DON levels in grain corn at harvest. Fungicides not labelled for ear mould suppression are not expected to reduce DON levels. When ear feeding injury is present, and conditions are suitable for ear mould development, properly timed insecticide applications may help reduce DON levels at harvest. Where ear-feeding pest pressure and ear injury are very low, or where conditions are not conducive for ear moulds, insecticides are less likely to decrease DON levels at harvest.
Further Comments on WBC and Ear Mould Management
Scouting is recommended for WBC management. The control threshold for WBC is when 5% of plants have either WBC larvae or eggs present and the field is near or at tassel or silking. Because larvae can only feed on tassel, silk or developing kernel tissues, eggs or larvae present well ahead of tassel or silk emergence will starve and not survive. If a field is at threshold near tassel timing, the ideal insecticide application timing is considered to be at 95% tassel emergence, or close to when fresh silks will be present. This is when larvae migrate to the developing ears to feed on silks. Generally, once a corn field is in tassel, WBC moths will prefer to lay eggs in other non-tasseling corn fields or edible bean fields. Those that have already entered the ear will be protected from an insecticide application.
Fungicides are just one of many tools such as available for mitigating ear moulds. Others include selection of tolerant hybrids, good crop rotation, and timely planting. Only certain foliar fungicides have been shown to aid in suppressing ear moulds. The two fungicides labelled for Gibberella ear mould suppression in the 2018-2019 Pub 812: Field Crop Protection Guide include Proline and Caramba. Ear moulds can infect ears through silk-initiated infection at the green silk stage, or through ear wounds which open the ear for infection. Proper application timing (at full fresh silk emergence but prior to silk browning) and water volumes are important for preventing ear mould establishment on silks. While slightly later than the optimum timing for an insecticide-only application, this would also be the preferred timing for combination fungicide + insecticide applications as well.
Evaluating Impact of Fertility Management on DON Levels
In extension to the insecticide/fungicide trials, corn fertility trials at the Elgin Soil and Crop Demo Farm presented the opportunity to evaluate the impact of fertility management on DON levels at harvest. Field observations in 2018 have many suggesting that more intensive management practices, or higher yielding fields may be associated with higher DON levels.
The Elgin Demo farm conducted corn plots in 2018 investigating yield response interaction between soil background soil fertility and starter fertilizer. Five soil fertility treatments were established in 2016 for investigating yield response in the following soybean, wheat and corn crops (Table 2). Treatments were replicated 3 times. The first two reps received starter fertilizer (Table 3), while plots in the third rep were longer in size and split between starter and no-starter fertilizer treatments. The entire field received a spring broadcast application of 0-0-60 @ 125 lb/ac (75 lb-K2O/ac) and received nitrogen as an injected side-dress application of 28-0-0 UAN @ 61.3 gal/ac (184 lb-N/ac) around the V6 stage.
Table 2. Background soil fertility treatments and the nutrient rates applied when established at the Elgin Demo Farm, 2016.
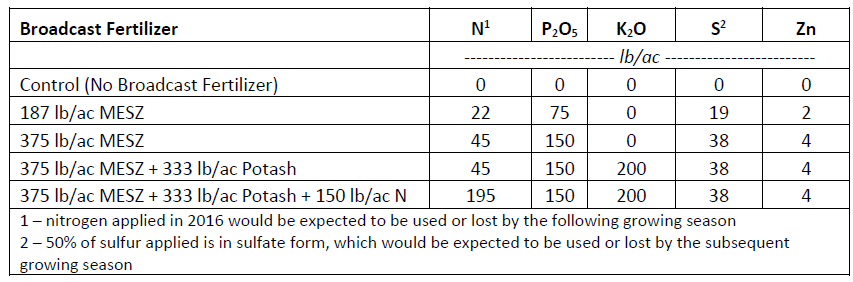
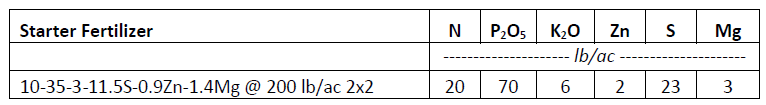
Table 3. Starter fertilizer applied as 2x2 band on planter on starter fertilizer plots at Elgin Demo Farm, 2018.
At harvest, DON samples were collected during each combine plot dump into a weigh wagon. A pail was used to collect a portion of the combine unload stream during the entire unload in efforts to collect a sample representative of the entire plot. Samples were split, then ground as described in “methods” above.
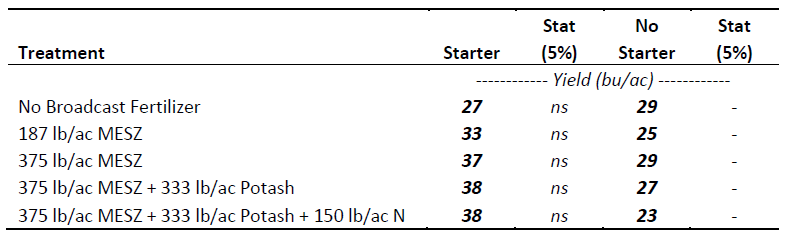
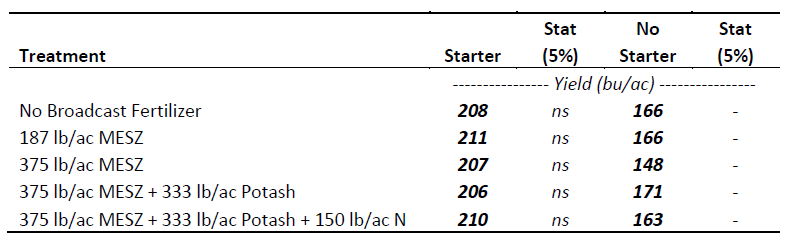
No significant yield differences were observed for the 5 soil fertility treatments where starter fertilizer was applied on corn in 2018 (Table 4). While the no starter fertilizer treatments were not replicated to allow for a statistical comparison of soil fertility treatments, or starter fertilizer vs. no starter fertilizer yields, the no starter fertilizer yields were much lower numerically than starter fertilizer yields, and lower than the least significant difference (LSD, p=0.05) of the soil fertility treatments for the starter fertilizer plots of 8 bu/ac.
Table 4. Yield response to soil fertility treatment.
While a general increasing trend of average DON levels was observed for increasing soil fertility treatments, no significant difference in DON levels were observed for the 5 soil fertility treatments where starter fertilizer was applied (Table 5). No corresponding trend was observed for yields (Table 4). The no starter fertilizer treatments were not replicated to allow for a statistical comparison of starter fertilizer vs. no starter fertilizer DON levels. While DON levels for no starter appear numerically lower then DON levels for starter, there was high variability (p>F = 0.093) across reps for the starter fertilizer treatments, with levels particularly high in rep 2. When comparing DON levels of starter vs. no starter plots in rep 3, no starter DON levels were only slightly lower numerically then DON levels in the starter plots. Overall, it is not clear whether background fertility, starter fertilizer, or yields had an influence on DON levels at the Elgin Demo Farm in 2018.
Table 5. DON response to soil fertility treatment.