Purpose
The fall of 2015 was extremely dry throughout most of southwestern Ontario, which resulted in the majority (90%) of wheat being planted at, and even before, optimal seeding dates. The early planting dates combined with abnormally warm fall weather resulted in the most advanced wheat fields having wheat plants with 7 to 10 tillers per plant. (Figure 1) This left many producers wondering how to best manage these wheat fields to maximize yield, and in particular, how to reduce the risk of lodging. In New Zealand and the UK agronomists recommend delayed nitrogen (N) application on extremely advanced wheat. Typically N applications would be delayed until the plant has reached Zadoc stage 32 (second node), with the concept that delayed N would “starve off” some of the weaker tillers. This trial was designed to compare different nitrogen (N) strategies on extremely advanced wheat in Ontario growing conditions, to both reduce lodging and maximize yield potential.
Methods
Intensive small plot design trials were conducted at 10 locations between 2016 and 2018. Each treatment was 20 feet wide by 60 feet long and replicated at least 3 times. The intensive small plot trials compared different N strategies and looked at the impact of seeding rate on yield and lodging. Five different seeding rates and 8 different nitrogen strategies were investigated depending on the size of the field. The treatments are listed below. An extremely early bean harvest in 2017 allowed two planting dates at 2 locations to compare the results from an ultra early seeding date to an optimal planting date for the region.
Seeding Rates
- 0.9 million seeds/acre
- 1.2 million seeds/acre
- 1.5 million seeds/acre
- 1.8 million seeds/acre
- 2.1 million seeds/acre
N Strategies
- 0 N
- 60 lbs N at Normal timing
- 90 lbs N at Normal timing
- 120 lbs N at Normal timing
- 150 lbs N at Normal timing
- 60 lbs N at Normal timing + 60 lbs N at Growth Stage (GS) 32
- 40 lbs N at Normal timing + 80 lbs N at GS 32
- 0 lbs N at Normal timing + 120 lbs N at GS 32
Normal N timing is considered to be mid to late April, while growth stage 32 (GS 32, Zadoc scale) typically occurs during mid to late May. Normal N was applied by spreading urea with a Valmar airflow unit, while UAN was applied using streamer bars at GS 32. Ten (10) lbs of Sulphur was applied across all treatments the same day as the normal N treatments. Calcium sulphate was the sulphur source to ensure no nitrogen was applied to the treatments, especially the 0 N treatment.
Four more field scale trials were conducted in 2016 and one in 2017 comparing N strategies 4, 7, and 8. Only fields with at least 4 or more tillers per plant were selected for this trial. Seeding rate was consistent across all field scale trials. A T3 fungicide was used at all locations.
Results
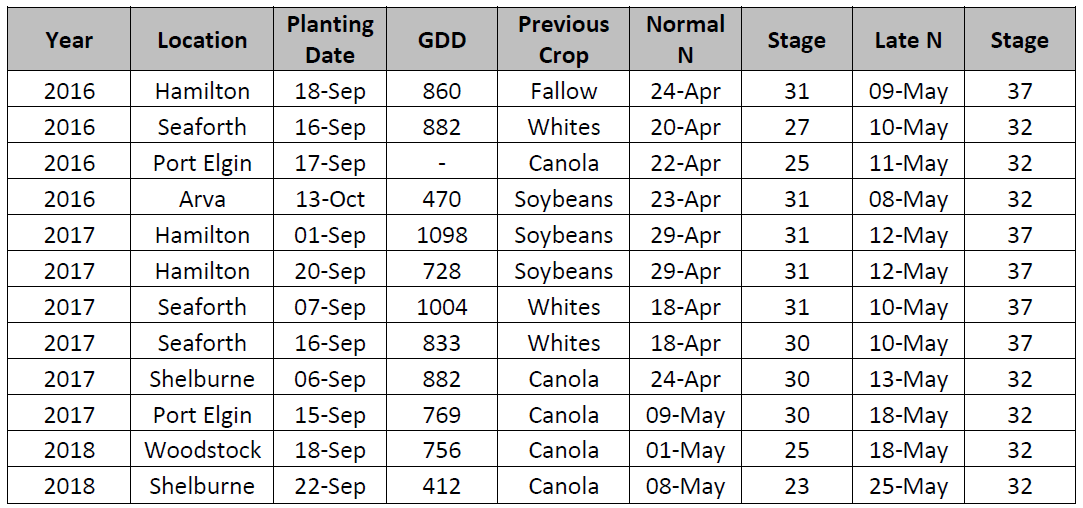
Some back ground data for the intensive sites including planting date, GDD (Growing Degree Days) accumulation, previous crop, nitrogen application dates and stages of application are shown in Table 1.The ideal GDD accumulation for yield and maximum winter hardiness is 450 GDD. The 2016 Seaforth location accumulated 882 growing degree days (Base 0C) from planting (September 16) until the end of December when colder temperatures arrived. Normal fall temperatures would accumulate 694 growing degree days during this time period at this location. The fall of 2017 was also abnormally warm with 833 growing degree days being accumulated at the Seaforth location between Sept 16th and Dec 3rd when colder temperatures moved in.
Table 1: Background Information
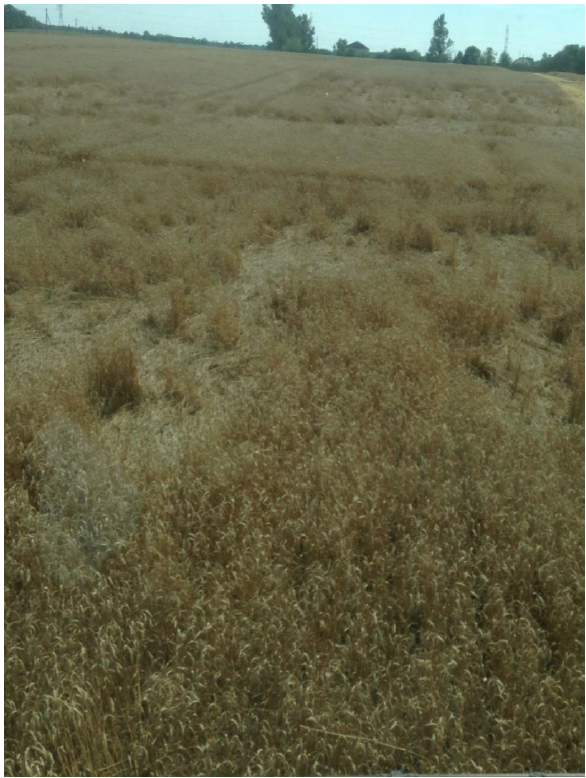
Early planting gave the plants plenty of time to tiller in the fall with some plants producing as many as 10 tillers at several locations. These high tiller counts along with high plant counts created an extremely thick canopy. This resulted in lodging at two locations in 2017 (Seaforth, and Shelburne). A picture from the Seaforth location is shown in Image 1.
Image 1: Crop Lodging at Seaforth Location
The lodging ratings from the Seaforth and Shelburne locations are summarized in table 2. The ratings were done on a scale of 0 to 10, where 0 is no lodging and 10 is completely flat. There are a couple of outliers but as expected the trend indicates the highest amount of lodging occurred with high rates of N applied early and high seeding rates. The 60/60 split had little impact on lodging score but putting on 40 N or less up front appears to reduced lodging risk.
Table 2: Lodging Ratings at Seaforth and Shelburne (rating from 0 to 10)
Plant heights were measured at the two sites conducted in 2018. The results are shown in table 3. Plant heights increased dramatically with the addition of the first 60 lbs of N and slowly trend upwards as more N is applied in the spring. Split N treatments were able to reduce plant heights as height is mostly set by the time the second N application was made at GS32. Similar to the lodging results the 60/60 did not have an impact on plant height.
Table 3: Plant Height (cm)
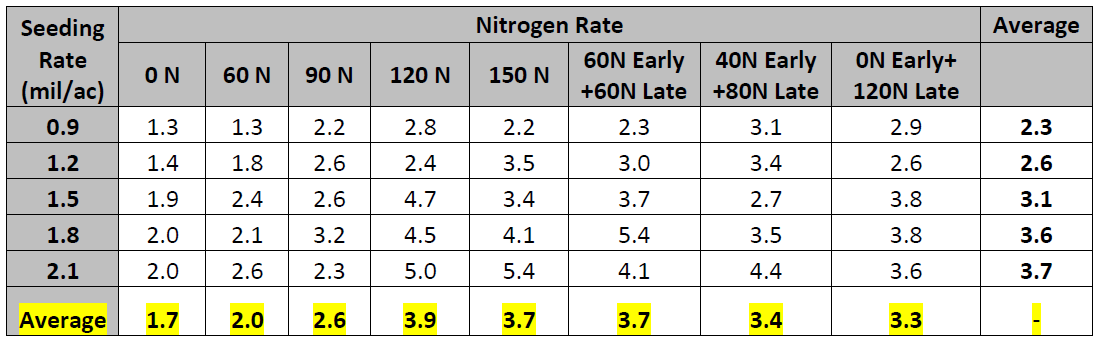
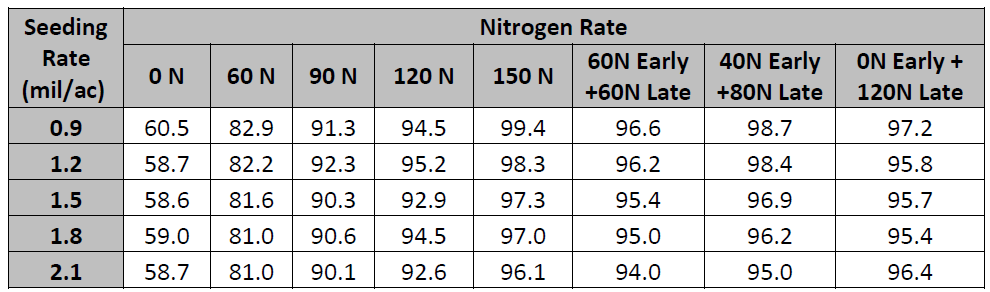
The average yield data from the 10 intensive sites is summarized in Table 4. The highest yield for each N rate occurred with the two lowest seeding rates and generally yields decreased as seeding rate increased. This is likely due to lodging and increased plant to plant competition between plants at the higher seeding rates. There is a slight yield advantage (1 to 4 bu/acre) for split applied nitrogen compared the single application of 120 N.
Table 4: Seeding Rate by Nitrogen Rate Yield Data (bu/acre)
 A ultra early planting date was added at 2 locations in 2017. Wheat was planted on September 1st at Cayuga and Sept 7th at Seaforth. Wheat was also planted on September 20th at Cayuga and September 16th at Seaforth which would be near the beginning of the optimal planting window at each location. The yield results from the ultra early planting date are summarized in Table 5, while the optimal planting date results are shown in Table 6.
Table 5: Ultra Early Planting Date Yield Data (bu/acre)
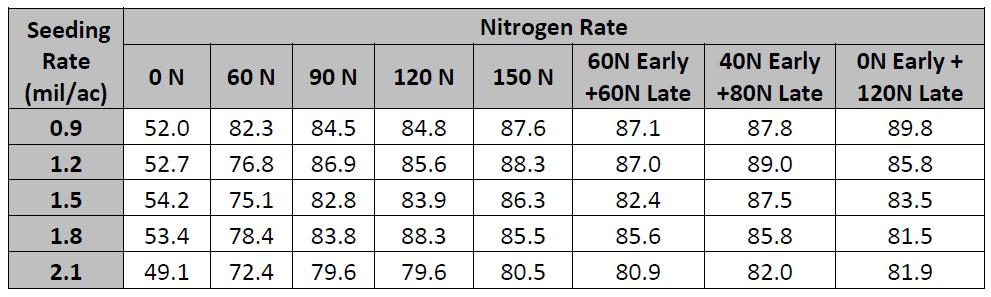
Table 6: Optimal Planting Date Yield Data (bu/acre)
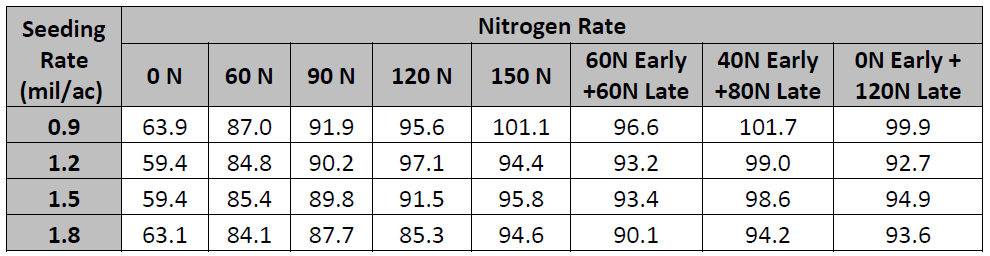
There was not enough room to include the 2.1 million seeding rate treatments in the optimal planting date block at the Seaforth location so results are only available up to the 1.8 million seeding rate. On average the ultra early planting date yielded 8 bu/acre less than the optimal planting date. The Seaforth location was affected by lodging while the Cayuga location experienced a high infection rate with barley yellow dwarf virus which is shown in image 2. Lodging and Barley yellow dwarf virus are 2 of the biggest concerns with early planted wheat.
The yield results from the 5 field scale plots are shown in Table 7. The St. Thomas site did have a significant yield loss associated with the late N treatment, while the Fingal site showed a significant yield advantaged with the late N treatment. More research is required to determine the potential yield implications associated with the late N application. On average there was no significant difference between any of the 3 treatments.
Image 2: Barley Yellow Dwarf at Cayuga Location
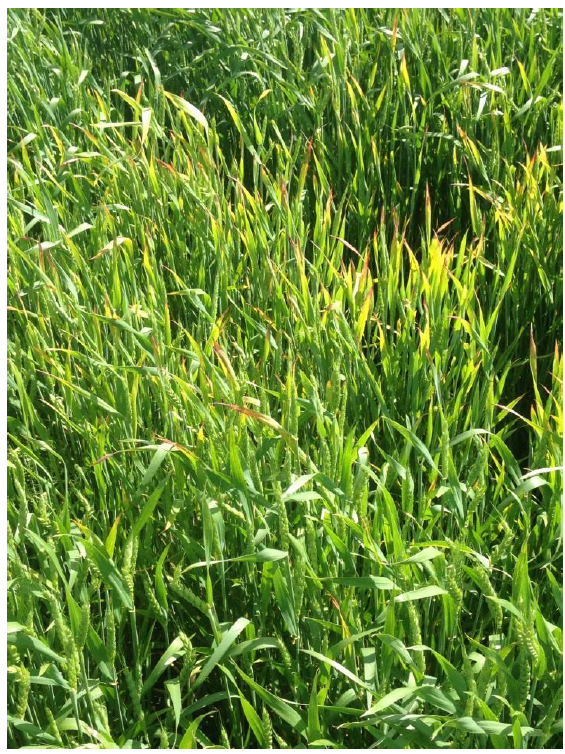
Table 7: Field Scale Yield Results (bu/acre)
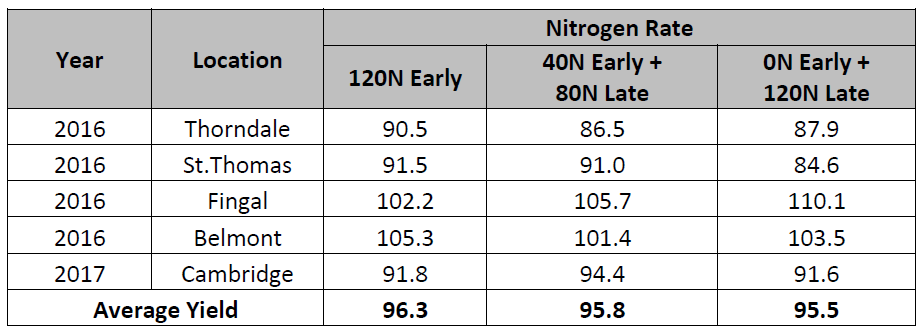
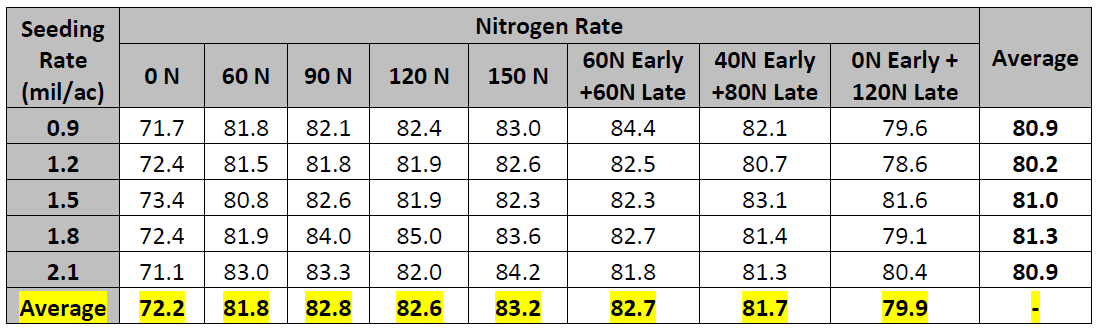
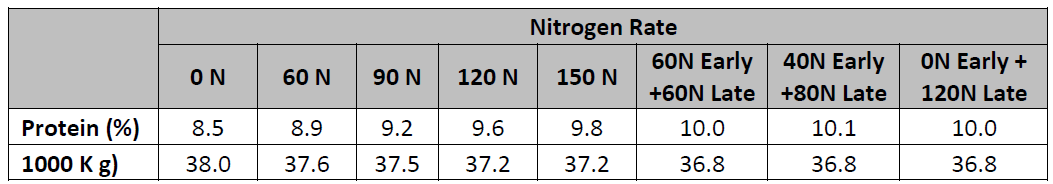
Table 8 contains the protein and 1000 kernel weight results from the intensive sites. Due to time constraints samples were only collected from a single seeding rate at most locations. Samples were taken across all seeding rates at two locations and no significant difference was seen across seeding rates.
Table 8: Protein and 1000 Kernel Weight
Summary
Planting wheat during the optimal planting date for your area gives your wheat crop the highest yield potential but it also comes with a few challenges. Abnormally warm fall temperatures can lead to high tiller counts and high plant to plant competition which can increase lodging risk. In order to obtain maximum yields with early planted wheat seeding rates should be reduced to 0.9 to 1.2 million seeds per acre. To further reduce lodging risk a split N application should be applied to reduce the amount of nitrogen available to the plant during stem elongation. The above data would indicate that in extremely thick canopy’s all nitrogen can be delayed until GS 32 when plant height has been set without giving up much yield potential. A sulphur application should still be made before GS 30 as wheat requires sulphur early in the spring.
Next Steps
This project will be continued in 2019. Seeding rate by N rate sites were planted at Shelburne on Sept 20th and Seaforth on Sept 22nd.
Acknowledgements
We are very appreciative of our many co-operators, many of whom stick with us year after year.
Project Contacts
Peter Johnson, Agronomist, Real Agriculture, pjohnson@realagriculture.com
Shane McClure, Research Lead, shane_mcclure@hotmail.com
Location of Project Final Report:
Peter Johnson, Agronomist, Real Agriculture, pjohnson@realagriculture.com