Purpose
A recent resurgence in interest with cover crops has many producers wondering what options work best. The hashtag #RootsNotIron has become a popular Twitter category, with a focus on multi species cover crops and planting the next crop into living, green, growing cover crops, generally with cover crop kill immediately following planting. The impact on yield and any practical field implications has not been well researched. This project attempted to evaluate these parameters across a range of cropping practices.
Algal blooms in Lake Erie have focused attention on the impact agricultural practices may have on the environment around us. This has put an even higher emphasis on soil conservation practices including cover crops and reduced tillage. It is beyond the scope of this project to measure the impact these practices have on reducing phosphorus losses: but this project will examine the effect that cover crops and reduced tillage have on soil health and crop yields.
In order to build long-term organic matter and not tie up nitrogen, it is important to have some high nitrogen residue (legumes or green leafy cereal plants) to go along with the high carbon residue that is left behind after corn and wheat harvest. This will help to balance the carbon to nitrogen (C:N) ratio and provide a variety of residues to feed a wide spectrum of soil microbes. The living roots of a cover crop also play a vital role in releasing carbon and other compounds into the soil to help feed the microorganisms in the soil for a longer period of time. In particular, phosphorus solubilizing mycorrhizae are said to not survive more than 14 days without living roots to maintain them. Maintaining living plants should keep these fungi alive and able to benefit the planted crop. The cover crop will increase plant biomass and carbon being returned to the soil, which will increase soil microbial activity. The increase in microbial activity will have numerous benefits on soil health including increased soil organic matter, soil structure and soil tilth.
Methods
Four wheat, three corn, and two soybean fields (9 total) carried through from 2015 across the Thames Valley and Heartland Regional Soil and Crop Improvement Association regions into the 2016 and 2017 growing seasons. Each field followed a corn, soybean, wheat rotation for the duration of the project. Plots were field scale with three replications. The treatments were:
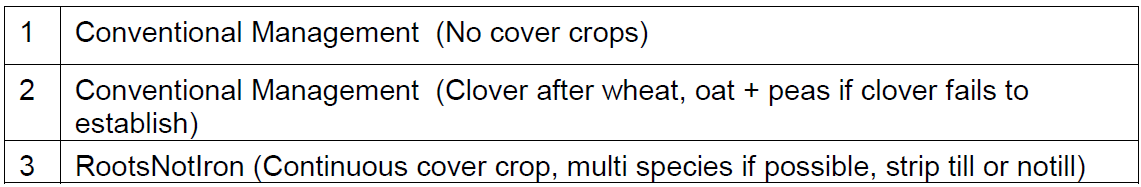
The RootsNotIron cover crop treatment interseeded into the growing corn crop was changed from a cereal rye/annual ryegrass/crimson clover blend in 2015 to an annual ryegrass/crimson clover blend for 2016 and 2017, which was not terminated until spring.
The rye mixture was planted at a rate of 46 lbs/ac (40 lbs cereal rye, 4 lbs ryegrass, and 2 lbs crimson clover) in 2015. However, the cereal rye simply did not withstand the competition, so in 2016 and 2017, 6 pounds/ac annual ryegrass plus 2 pounds/ac crimson clover was seeded at 6 leaf corn. Soybeans were planted no-till directly into the cover crop. Once the soybeans are harvested wheat was no-tilled into the soybean stubble. After wheat harvest a multi-species cover crop was the planted in treatment 3. The multi-species cover crop was planted at 110lbs/ac (30 lbs oats, 30 cereal rye, 20 sunflower, 20 peas, 4 ryegrass, 2 radish, 2 clover, 2 phacelia). The multispecies cover crop was left till spring when corn was planted directly into the cover crop or following a single strip till pass.
Tillage was done on treatments 1 and 2 following the co-operators normal practice but treatment 3 did not receive any tillage for the duration of this project. All other variables (i.e. starter, nitrogen, manure) were the same for all three treatments following the cooperators normal production practice.
Soil samples were taken from each location to determine baseline soil health levels. At the completion of this project each treatment was soil sampled to determine the effect each treatment had on soil health.
Results
In the initial year no treatments had been established prior to the corn being planted, thus the corn was planted following the co-operators normal practice. The “plant green” treatment was then interseeded into the corn at the 6 leaf stage in the continuous cover plots. The yield results from the three corn sites, along with yield results from several other farmer conducted trials with the same treatments are shown in Table 1.
Table 1: Corn Yield Results from Inter-Seeded Rye (bu/ac)
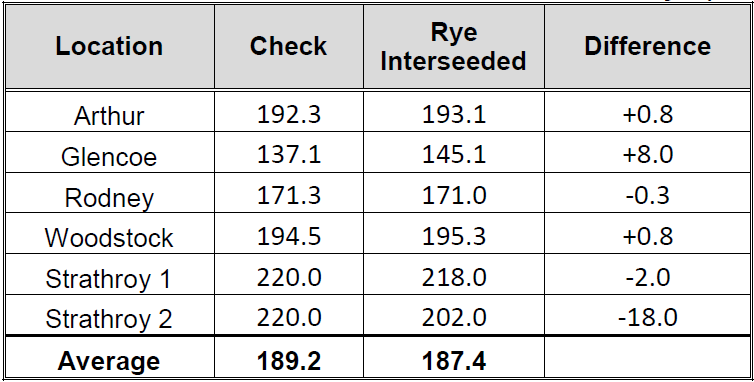
At four of the 6 sites there was no significant difference in yield whether a cover crop was interseeded or not. Two locations stand out in Table 1. There was an 8 bu/ac yield increase at the Glencoe site when cover crop was inter-seeded, while Strathroy #2 lost 18 bu/ac by inter-seeding. More research will need to be done to determine what conditions lead to an increase in corn yields at Glencoe, while there was a significant reduction in yield at Strathroy #2, or if this was just a random outcome.
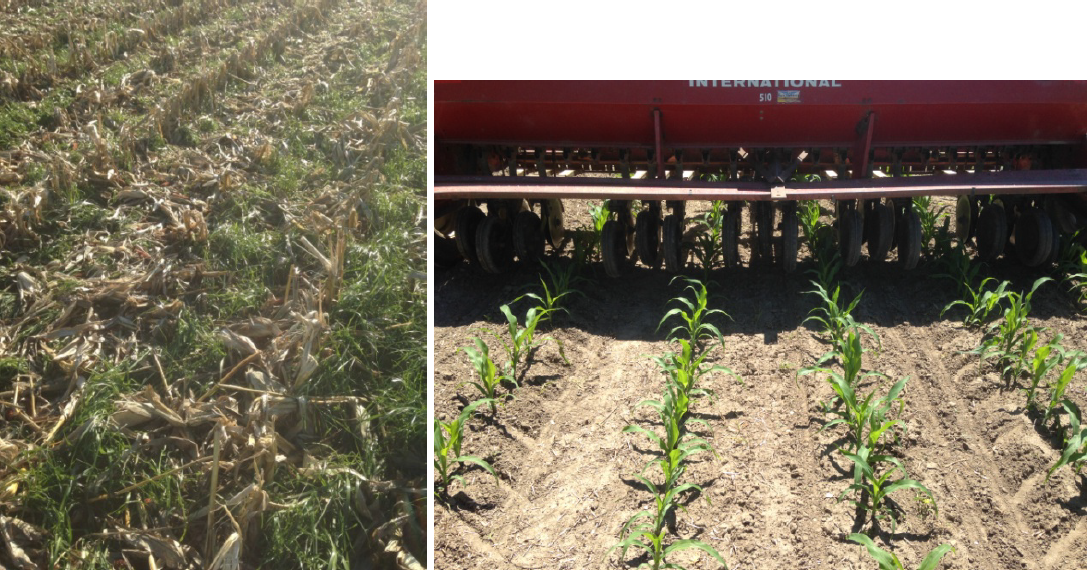
All three corn sites had good to excellent annual ryegrass establishment during the 2015 and 2016 growing seasons. Image 1 shows the excellent ryegrass growth that occurred at the Arthur location in 2015 and a modified seed drill used to interseed the rye at several locations. Unlike the first 2 years of this project ryegrass establishment was poor during 2017 growing season.
Image 1: Rye after corn harvest (Nov 16, 2015) and modified drill
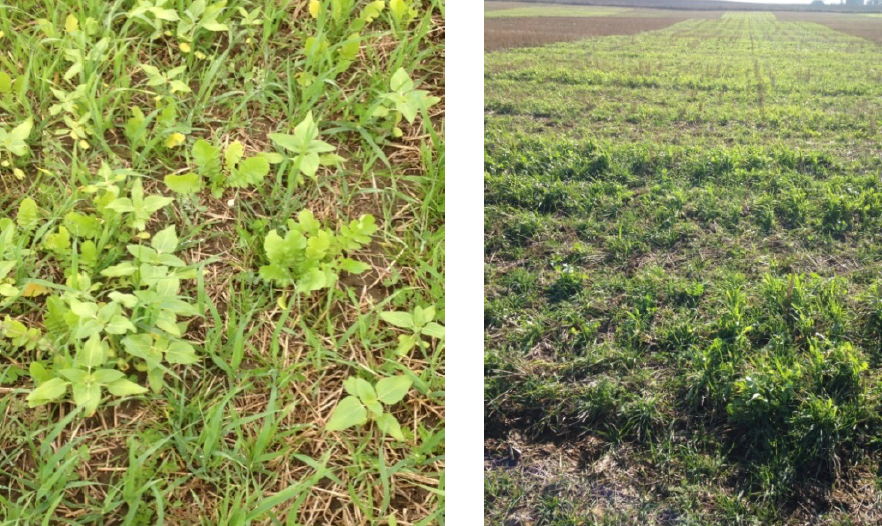
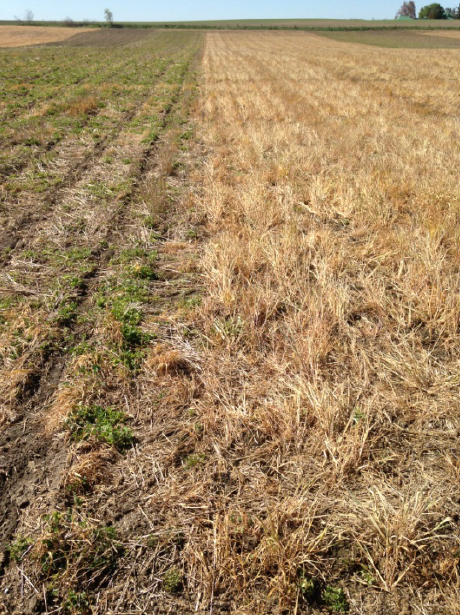
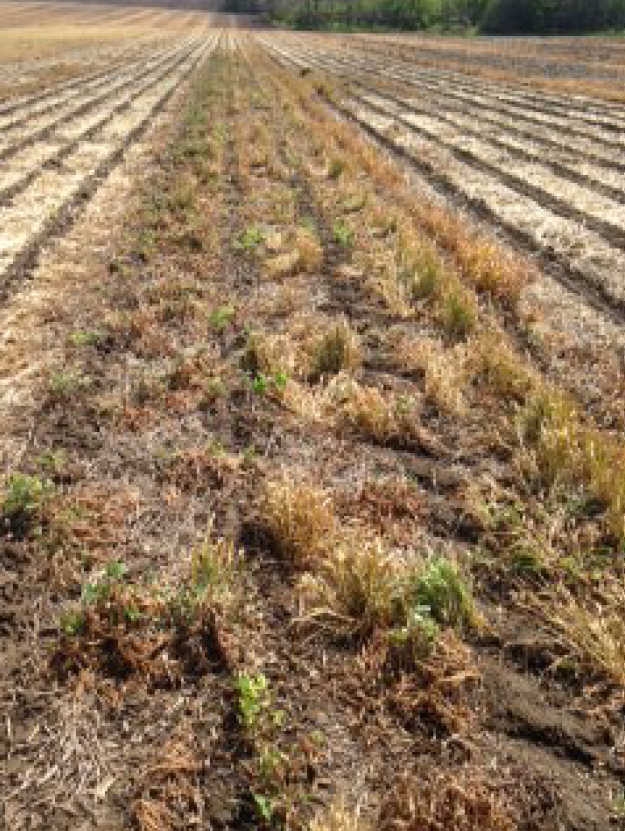
Clover stands were astounding following the 2015 wheat crop. Perfect stands and excellent growing conditions well into the fall resulted in tremendous growth. The multi-species cover crop (Image 2) establishment was also excellent at two of the three wheat locations. Rough, uneven ground conditions resulted in variable seeding depth which, combined with inadequate rainfall, resulted in a variable stand at the third site (Image 3). Clover stands following the 2016 wheat crop were mediocre so a mixture of oats and peas at 30lbs/acre was planted into the clover to fill in the spots without clover.
Image 2: Multi-Species mix (Oct 14, 2015); Image 3: Uneven cover crop growth
In the second and third year of the project corn was planted directly into the multi species cover crop. At the 2016 Bornholm and 2017 Lucan sites the corn was no-tilled into the living cover crop while the other 2 conventional treatments received tillage prior to planting. At the 2016 Elmira and 2017 Embro locations all treatments received a single pass with a strip till unit prior to planting. At the 2016 Lucan, and 2017 Dungannon sites all strips were planted no-till.
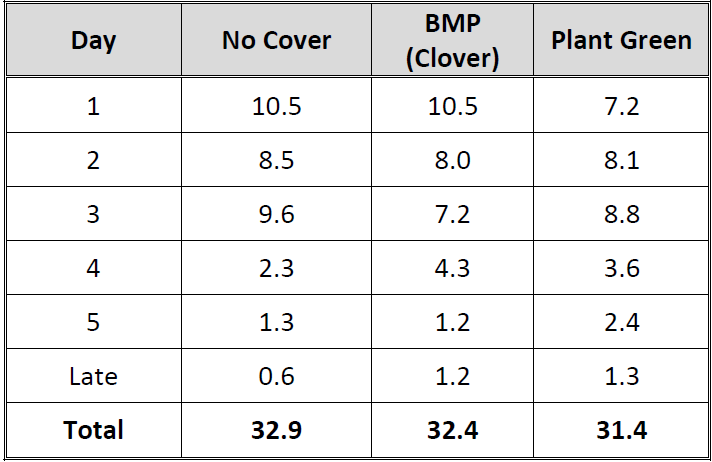
Corn emergence was tracked at each location. To do this 5.3 meter row length (1/10th acre) was marked off across several rows in each treatment after planting. Each day a different coloured flag was used to mark each plant that had emerged that day. These results are summarized in Table 2. Any corn plant that emerged after day 5 was recorded as a “late emerging”. The emergence data is fairly similar from the no cover and BMP treatments while emergence from the plant green treatment was slightly slower, and about 1000 plants/acre less in total.
Table 2: Number of Plants to Emerge Each Day (plants/5.3 meters of row)
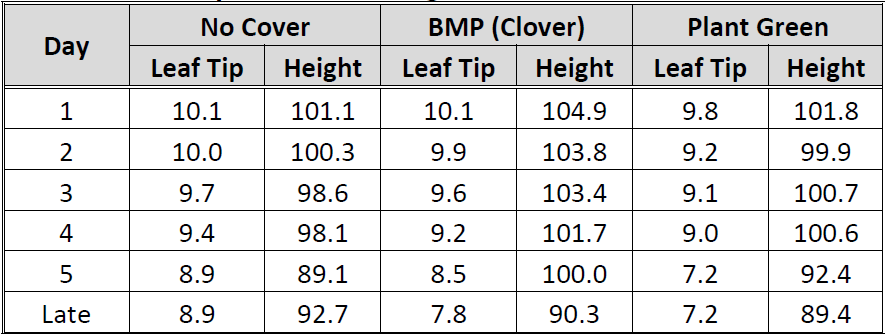
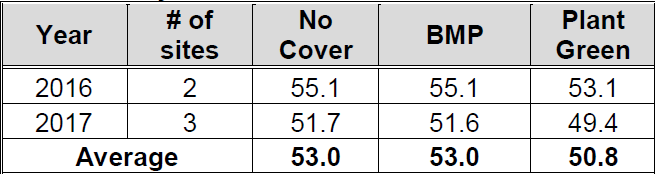
These plants were followed through the growing season to determine differences in growth. Leaf tips were counted around the 10- leaf stage and are summarized in Table 3 along with the plant height measurements. Again, there is little difference in leaf tip counts between the no cover and BMP treatments. However, one surprising outcome was that the corn plants in the plant green treatment continued to fall further behind the other 2 treatments. The plants emerged a little slower, but then continued to fall further behind plants that emerged on the same day in the other 2 treatments. This slowed development could still be seen at tassel timing, with the plant green treatments lagging. Plant height differences were unexpected. The plants in the BMP treatment have separated from the no cover treatment, while the plant green heights are similar or slightly taller than the plants in the no cover treatment.
Table 3: Leaf Tip and Plant Height
The corn yield results from these locations are six sites are summarized in table 4.
Table 4: 2016 Corn Yields (bu/ac)
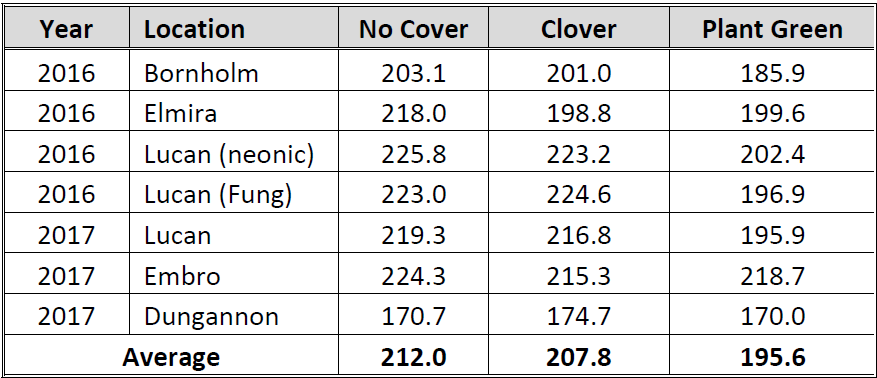
Substantial yield loss occurred at 4 of the 6 locations with the plant green treatment (Roots Not Iron). At these 4 sites yield loss ranged from 18 to 25 bu/ac. There was little yield difference between the no cover crop treatment and the BMP treatment except for the Elmira, and Embro locations.
At the Elmira location, red clover was not terminated in the fall as planned, and control was not able to be applied until 3 days prior to planting. The yield loss in the red clover treatment at this location can be explained by looking at the greenness ratings (Table 5). The greenness ratings were taken on the same day as the corn first emerged using the Canopeo app, developed by the Soil Physics Research Group at Oklahoma State University. No Greenness ratings were taken at Lucan in 2016 but visually the plant green treatment still had lots of green tissue left when the corn plants emerged. The greenness ratings show that the clover was still green at Elmira when the corn emerged. Image 4 shows visually how much green cover remained in the clover strips at emergence. This shows that any green material has the same impact on the corn crop, whether red clover or some other species. Table 4 shows that the yield impact of green clover at Elmira was exactly the same as the impact of the green multi species mix.
Table 5: Greenness Ratings
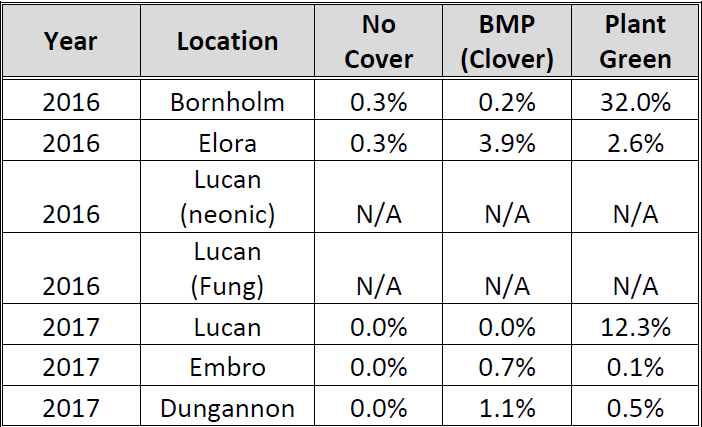
Image 4: Elmira Clover Cover Crop vs Multi Species Mix
The Embro site had variable treatment results between reps. Some of the variability can be explained by looking at the stand count and greenness results from each rep (Table 6). Yield results are quite consistent across the reps except for Plant Green rep 2 and BMP rep 3 which are highlighted. Both of the strips had substantial yield loss compared the rest of the treatments and the reason may be explained by looking at the stand count data and greenness ratings for the reps in question. A strip till unit was used at this location and the planter got off line with the strip till row in a few spots in both plant green rep 2 and BMP rep 3. This resulted in some of the seeds being left on the soil surface, and a substantially lower population in the 2nd rep of the plant green treatment which could explain the low yield result. The 3rd rep of the BMP treatment had a slightly lower stand count but when combined with the higher greenness rating may explain the yield loss for the BMP strip. The high greenness rating is due to a sprayer miss in the fall of 2017. The spring herbicide application did kill the wheat and clover but did not manage to brown all the clover off before the corn emerged (Image 5).
Table 6: Embro Corn Plot Results
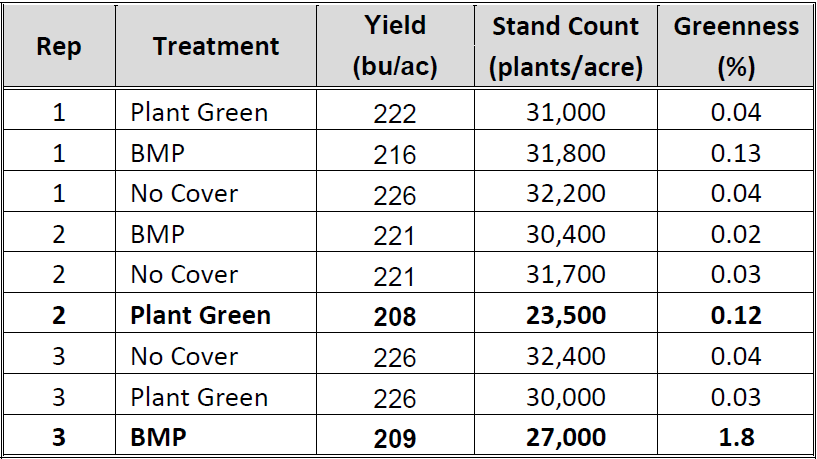
Image 5: Embro BMP rep 3 at Emergence
The Greenness ratings also indicate why there wasn’t a substantial yield loss at the Dungannon location. There was very little green material left in any of the treatments when the corn plants emerged. This site was planted late and sprayed two days before planting. The combination of warm temperatures and spraying before planting resulted in the ryegrass and any crimson clover that overwintered being brown and dead before the corn emerged. Due to this impact, yield results from Elmira, Embro, and Dungannon should really be viewed separately from the other locations.
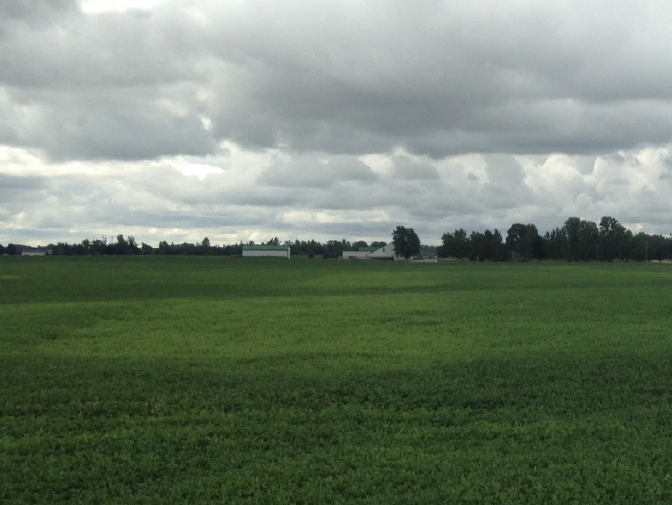
In 2016 and 2017 the soybeans were also planted into a living cover crop in the Roots Not Iron treatment. Image 6 shows soybeans being no-tilled into cereal rye at the Rodney location.
Difficulties maintaining good seed to soil contact plagued the plant green treatments wherever no tillage was done. Soybean stands were reduced by 10% (Table 7) in the plant green strips. While this did not reduce yields by 10%, it does indicate the problems associated with living roots holding tightly to soil, and the difficulties that this can present when attempting to get good seed to soil contact and close the slot. On average across all sites there was a 2 bu/ac yield loss to the plant green treatments (Table 8).
Image 6: Soybeans being no-tilled into Cereal Rye
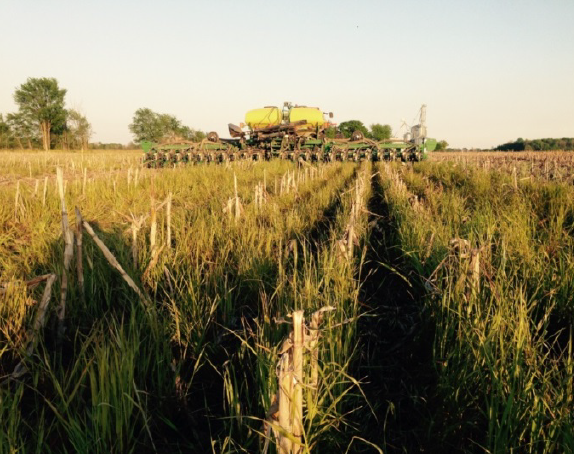
Image 7: Slot closure issues in Plant Green soybeans
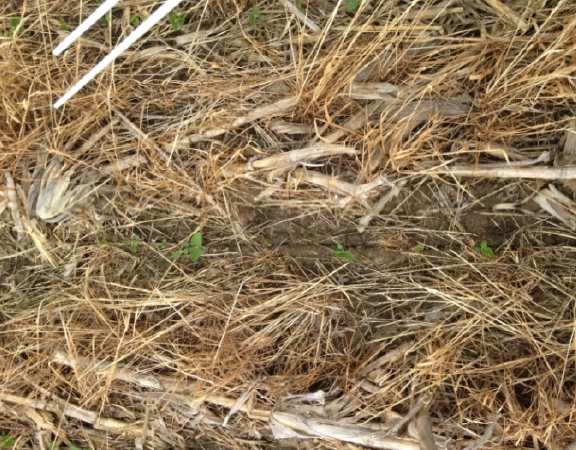
Table 7: Soybean Stand Counts
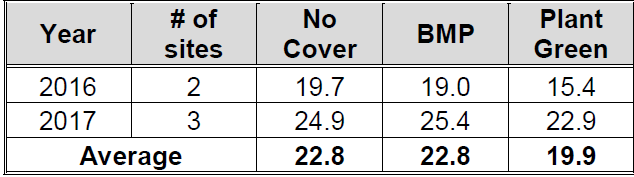
Table 8: Soybean Yield Results
At one location in 2017 the plant green strips started to turn yellow during July showing symptoms similar to nitrogen deficiency (Iimage 8). A tissue analysis was done to determine if there was a difference in nitrogen concentration between the plant green and BMP treatments. The plant tissue results are shown in Table 9.
Image 8: Yellowing in Plant Green Treatment
The nitrogen content in the BMP treatment is quite a bit higher than the plant green treatment. Plants were dug up in each treatment to confirm that plants had nodulated and the nodules were active, which they were in all treatments. The only conclusion is that there must be lower soil nitrogen levels in the plant green treatment. The probable cause of the lower soil nitrate levels is that the nitrogen is being tied up as the annual ryegrass cover crop is being broken down. The higher phosphorus and potassium levels in the plant green tissue analysis is likely due to nutrient build-up in the plant as low nitrogen levels stunt plant growth. Calcium, magnesium, sodium, iron, manganese, copper, zinc, and boron are all at sufficient concentrations.
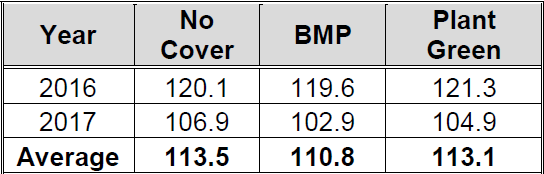
The wheat results are shown in Table 10. Numerically the BMP treatment yielded slightly less than the other 2 treatments but overall there was no statistical difference in yield across treatments.
Soil samples have been taken to compare soil health between treatments, but results are still pending.
Summary
Inter-seeding annual ryegrass/crimson clover into an existing corn crop had no significant impact on corn yield. Major yield loss was found when corn was planted into a green cover crop. Hypothesized reasoning is twofold: emerging corn plants sensing the presence of other green plants nearby which causes the corn plant to alter its growth pattern, and the difficulty in getting the sufficient required seed/soil contact through masses of living roots. The research showing that plants are able to sense other plants nearby has been well documented by Dr. Clarence Swanton at the University of Guelph. A reduction in rate of development of the corn plant was also found in the plant green treatments. This may add to the reasons for reduced yield.
Table 9: Plant Tissue Results
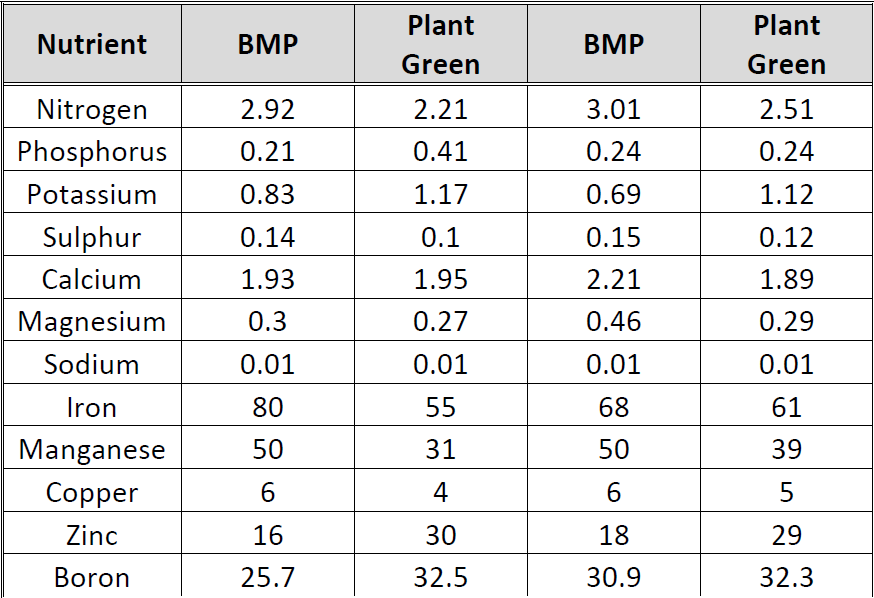
Table 10: Wheat Yields (bu/acre)
From yield numbers in this project, it appears soybeans may be able to handle the stress of plant green better than corn. Soybeans suffered only minor yield loss (2 bu/ac) when planted into a green cover crop, however this yield loss was quite consistent across sites. Nitrogen deficiency in the soybean crop was identified at one location and could be another issue that growers need to be aware of. More research is needed study the effect that planting green has on a soybean plant.
There was no significant difference in wheat yields across treatments.
Next Steps
This trial is now complete. The trials will be continued next year at a few locations which had a multi-species cover crop planted after the wheat or ryegrass planted into corn during the 2017 growing season.
A continuation of this study with a modified “plant green” treatment would be of great value. This modification would include some form of strip till (bio-strip till, mechanical strip-till) to avoid the seed to soil impacts that where experienced.
Acknowledgements
Huge thanks to our co-operators. Thanks to summer assistant Alison Buckrell, technician Shane McClure, and administrator Marian Desjardine. Special thanks to Cathy Dibble for helping to coordinate sites and data. This project would not be possible without the support and funding of the Ontario Soil and Crop Improvement Association.
Project Contact:
Peter Johnson, Agronomist, Real Agriculture, pjohnson@realagriculture.com
Shane McClure, Research Lead, shane_mcclure@hotmail.com
Cathy Dibble, Thames Valley SCIA cdibble@ontariosoilcrop.org