Purpose
To compare A & L Canada Laboratories’ new soil health analysis (Vitellus) and other soil health measures to yield and plant performance.
Methods
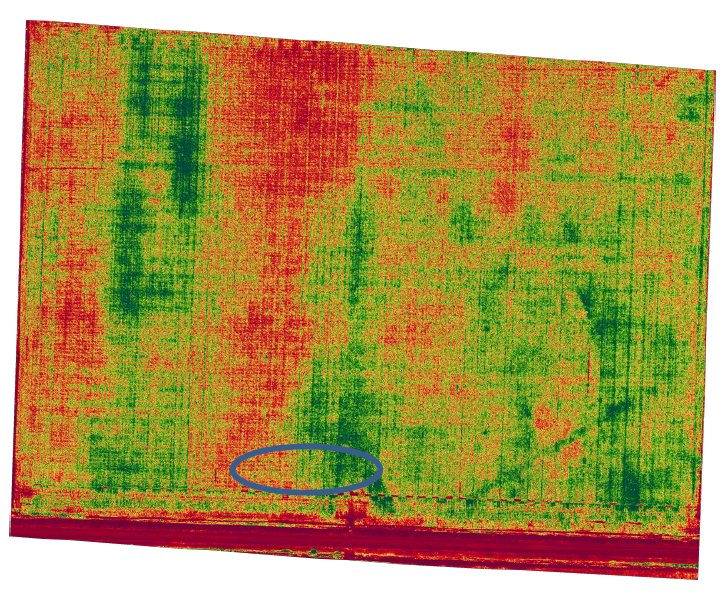
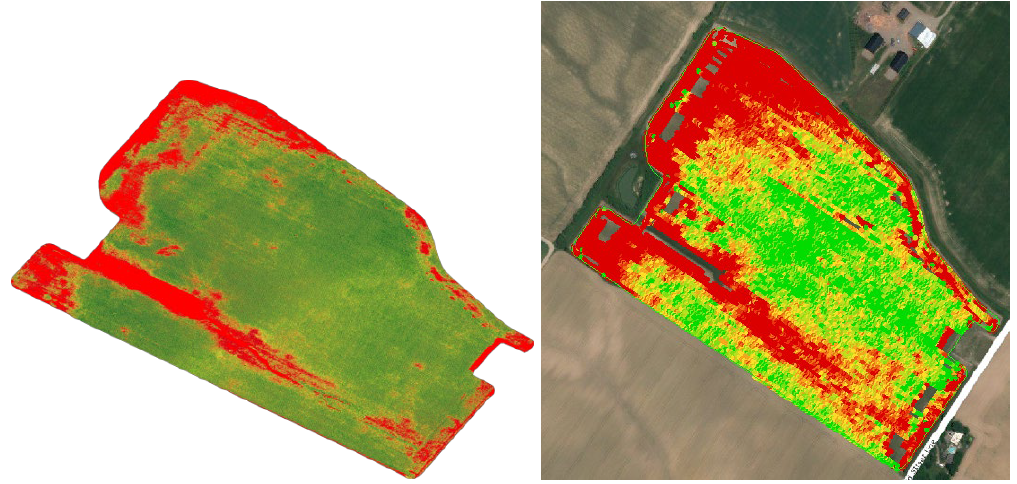
Each year of the project up to seven co-operators from each county (Lambton, Kent, Essex) were to provide corn fields to be sampled. The cooperators had to have a combine yield monitor and be able to generate yield maps for the field. Field location information was collected and sent to Warriner Ag in years 1 and 2 (in 2020 it was sent to AGRIS). The location information is used to create field boundary maps. The maps are used by AGRIS Co-operative to have aerial imagery flown using Normalized Difference Vegetation Index (NDVI) technology for each field, see figure 1. This took place once the corn had reached the V10 stage (10 leaf collars) and no later than the R1 growth stage (silking – silks emerging from husks at tip of ear). The imagery was used to identify areas of the field that are healthy and areas that are stressed.
Figure 1. Normalized Difference Vegetation Index (NDVI) Map showing where the samples were taken from (green areas represent healthy areas and red indicates stressed areas).
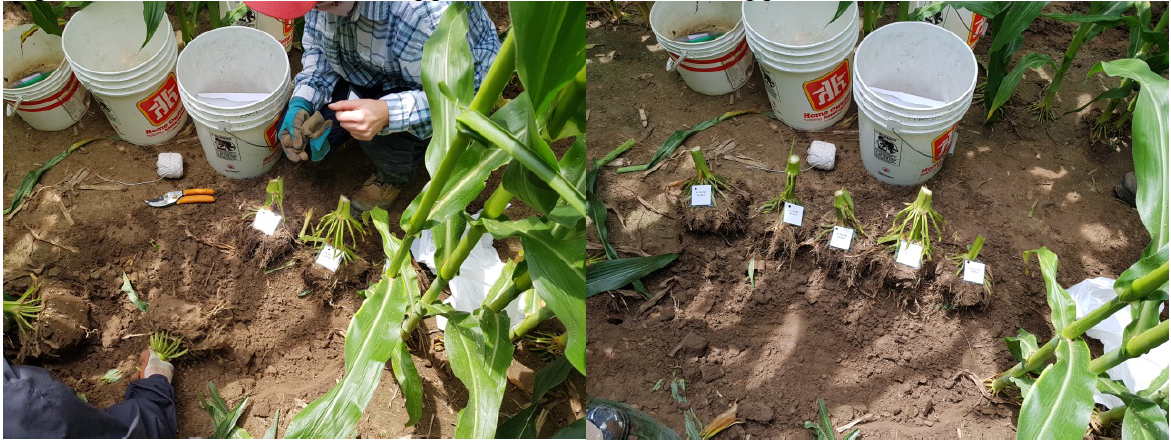
 One stressed area and one healthy area were sampled in each field. At each sampling point 5 corn root balls were dug up and individually bagged and tagged, see figure 2. The letters A and B were randomly assigned to the healthy and stressed samples. The growth stage of each plant, sample date and GPS coordinates were recorded. Twenty soil cores (six inch depth) were taken for aggregate stability analysis (note change in procedure in 2019). The soil and root balls were sent to A & L Laboratories within a day or two of sampling. Soil was sampled from the root ball and analyzed for fertility. Soil from the root ball was analyzed using the A & L Laboratories soil health test Vitellus and a portion of the root from each root ball was analyzed to assess the microbial community. The aggregate stability analysis was completed in Dr. Laura Van Eerd’s lab at University of Guelph Ridgetown Campus using the automated wet sieving method by an Ontario Ministry of Agriculture, Food and Rural Affairs (OMAFRA) summer student (in 2020 the samples were sent to SGS Labs for the aggregate stability analysis).
Figure 2. The root balls are tagged and ready to be bagged and sent to the lab.
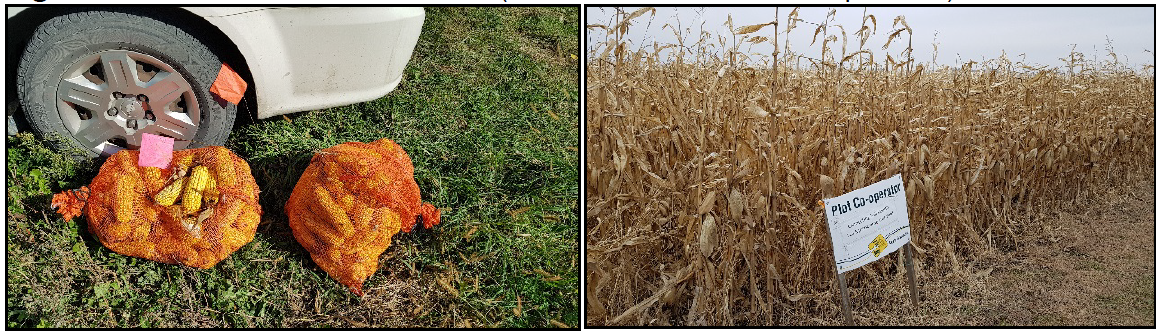
Just prior to harvest, corn cobs were harvested from two rows (1/1000 of an acre per row) adjacent to each of the sample points in each field. The samples were shelled and hand harvest yields were calculated for each sample point. Each co-operator was to harvest their field using a combine equipped with a GIS capable yield monitor. Yield data for an area 30’ long by the width of the combine for each sample point was to be used to compare yield to the soil health and root microbial analysis. Due to a number of inconsistencies with GPS coordinates, yield monitor malfunctions and in 2018 abandoned fields due to DON; the hand yields proved to be a more reliable data set.
Figure 3. Yield was hand harvested (2 rows 1/1000 of an acre pre row)
Basic crop information was collected as well as soil management history for each field. This provides background on management practices which then can be used to understand if any specific BMP’s along with any soil health test characteristics lead to higher yields and healthier soils.
Results
2018 was a challenging year to start the project with a wet planting season, dry mid season and a wet harvest. DON further complicated the harvest and resulted in the loss of some harvest data. 17 fields were sampled and analyzed for the Vitellus suite of tests and also aggregate stability. The full data set was further analyzed in Dr. Laura Van Eerd’s lab for significance using principal component analysis. With the bulk soil there was no clear separation detected between healthy and stressed zones. There was a trend towards greater yield, organic matter and P in healthy than stressed zones. However in the rhizosphere, soil Zn and microbial active C were greater in the healthy than stressed samples while Fe, Al, % saturation Al, nitrate-N and water extractable inorganic N were greater in the stressed than healthy areas. This of course is data from only one year.
Site selection (i.e. healthy versus stressed and site within the field e.g. distance from headland to allow for yield monitor accuracy), sample timing, site identification/documentation and a project protocol document were identified as areas that needed refinement for 2019. It was also suggested that the bulk soil samples did not need to be collected as the fertility samples could be taken from the soil associated with the root balls.
Most of the fields had fairly similar hand yields between the sites A and B selected for this study. On seven out of the seventeen fields studied, the differences in yield between the sites A and B were less than 10 bu/ac; on five fields the differences in yields between sites A and B were between 10 and 20 bu/ac; and in only four fields were those differences more than 20 bu/ac. One of the fields was harvested before hand yields could be taken.
The fall proved to be challenging as well. Two of the fields were not combined due to high levels of DON. Some of the other fields were later being harvested (into January) due to wet field conditions. Other challenges included data gaps in yield maps where the samples had been taken. Figure 4 shows some fairly good similarities between the NDVI map and the combine yield map.
Figure 4. NDVI map flown on July 18, 2018 on the left and the yield map on the right.
The soil around the roots was analyzed using the A & L soil health test. Overall eight of the fields showed higher numbers for several soil health indicators where the samples were taken from healthy areas.
Table 1 below lists several soil health indicators comparing healthy areas to stressed areas. Organic matter, Solvita CO2-C, reactive carbon, % microbial active carbon, NRCS soil health calculation and biological soil quality appear to be valid soil health indicators with slightly half of the “healthy” areas displaying higher values than the “stressed” areas.
Table 1. Soil Health Indicators of Healthy Areas Compared to Stressed Areas (2018)
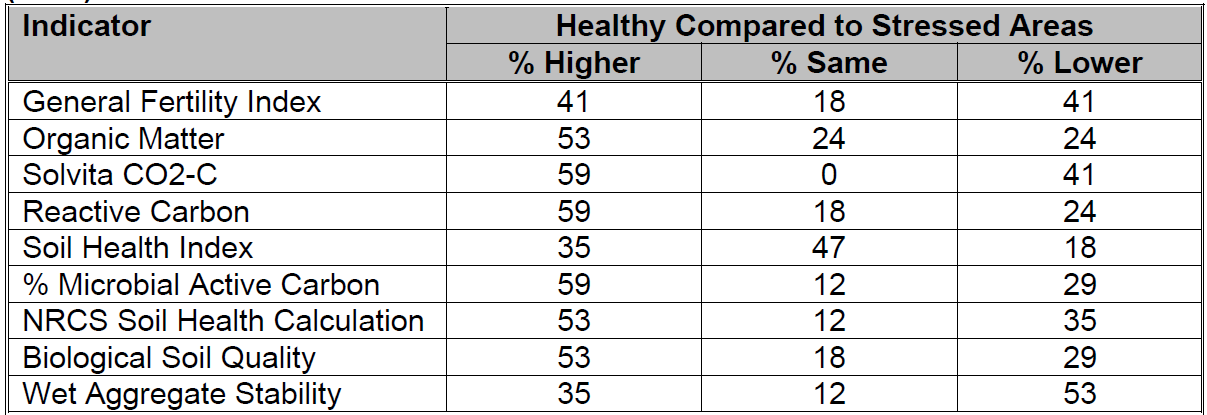 See notes on Indicators at the end of report for more information on individual indicators.
The project partners met to review the protocol and 2018 experiences, particularly around site selection within a field. This discussion resulted in some revisions to site selection and sample collection.
2019 was the second year of this project. 18 fields were volunteered by soil and crop members for the project. Locations ranged from as far west as Harrow to just outside Arkona in the north end of Lambton county. Extended wet conditions during planting meant that several fields that were supposed to be part of the project were missed and other locations substituted. Most fields were clay, clay loam or loam soils with a few sandy loams. Once again, it was a challenging year with delayed planting due to wet conditions, followed by dry conditions mid-season and a return to wet conditions during harvest.
The delayed and drawn out planting made it difficult to know when the fields would be ready to be flown for the NDVI. In some fields the NDVI maps did not show a lot of differences in the field making it difficult to choose healthy and stressed spots in the field. Where available, previous yield maps were consulted to select sample areas.
The NDVI imagery is a snapshot in time, showing crop condition at that time. In 2019 there were a couple locations where the good and stressed sites had switched by harvest time. Early good growing conditions set the crop up to look good but later weather stresses contributed to a lower yield.
Figure 5. All 17 sites were hand harvested. The late start to the planting season meant a later harvest with some project fields not being combined until winter. Stalk strength was a significant issue in one location.
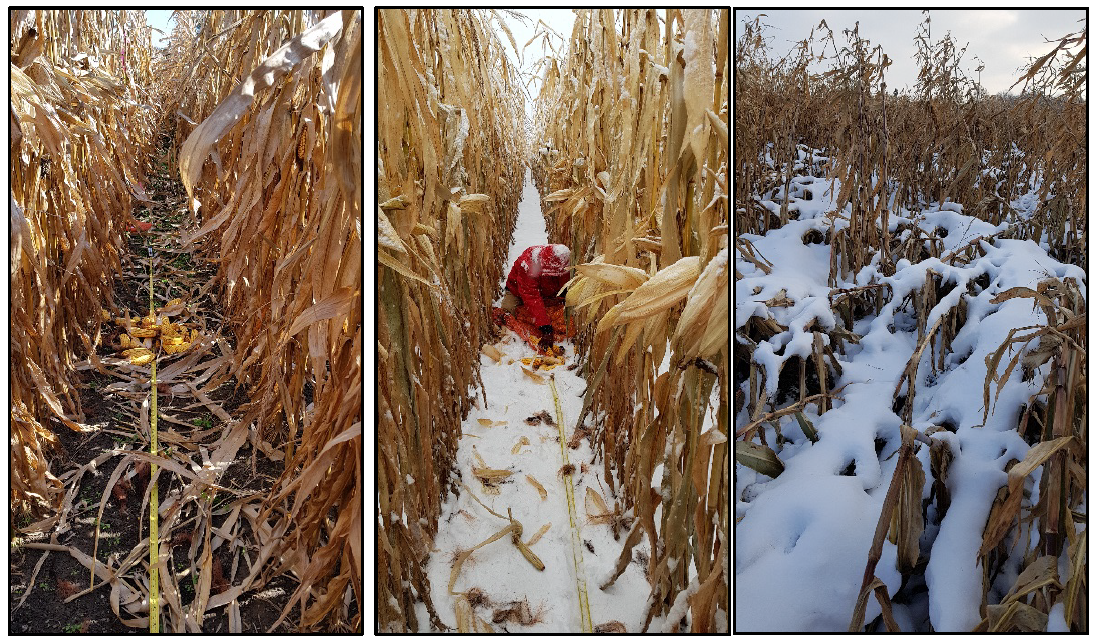
Table 2 below lists several soil health indicators comparing healthy areas to stressed areas. For the 2019 sites general fertility index, Solvita, reactive carbon, microbial acive carbon and wet aggregate stability appear to be valid soil health indicators with more than half of the “healthy” areas displaying higher values than the “stressed” areas.
Table 2. Soil Health Indicators of Healthy Areas Compared to Stressed Areas (2019)
In the third and final year of the project, 14 fields were sampled from across the St Clair region from Harrow to Watford and across a variety of soil types. The field number was reduced for a number of reasons ranging from previous cooperators having a shift in corn acreage and yield monitor issues. The weather across the region cooperated with only short dry conditions in late summer. Access to the University lab was limited(due to Covid) and a lack of student support, consequently the aggregate stability samples were sent to SGS Labs in Guelph for analysis where soil texture analysis was also completed.
Based on the last two years experience, site selection relied heavily on soil maps, historical yield maps where available and the NDVI imagery supplied by AGRIS. Site selection appeared to be more consistent in 2020 in terms of yield aligning with the good/stressed areas selected from the NDVI maps. Based on the soil maps (accessed in field through Ag Maps http://www.omafra.gov.on.ca/english/landuse/gis/portal.htm) all but 1 field was consistent in soil series between the two sampling areas. From the soil textural analysis there appears to be a bit more difference. Topsoil depth was estimated at each sampling area using a soil probe. There was only one location where the “stressed” had a deeper topsoil layer than the good. On average across the 14 sites the “good” sites had 1.1 inches greater topsoil depth.
Corn yields across the sites ranged from 146 to 252 bu/acre (hand yields). Only one location had a slightly higher yield in the “stressed” area; the average difference was 35.7 bu/acre (range -3 to >90).
Table 3.Yield and physical soil differences
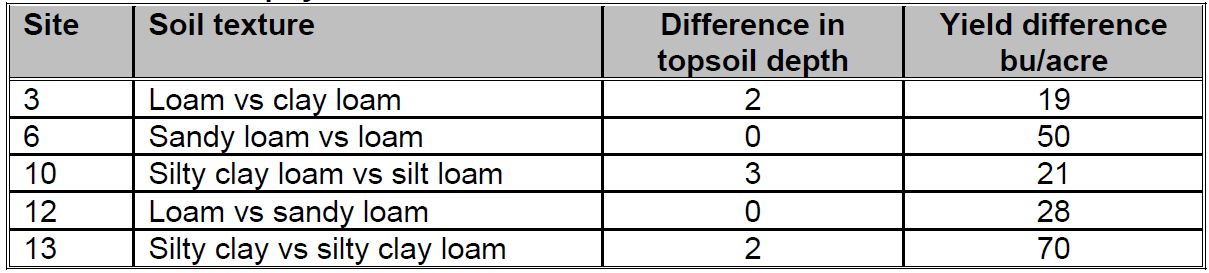
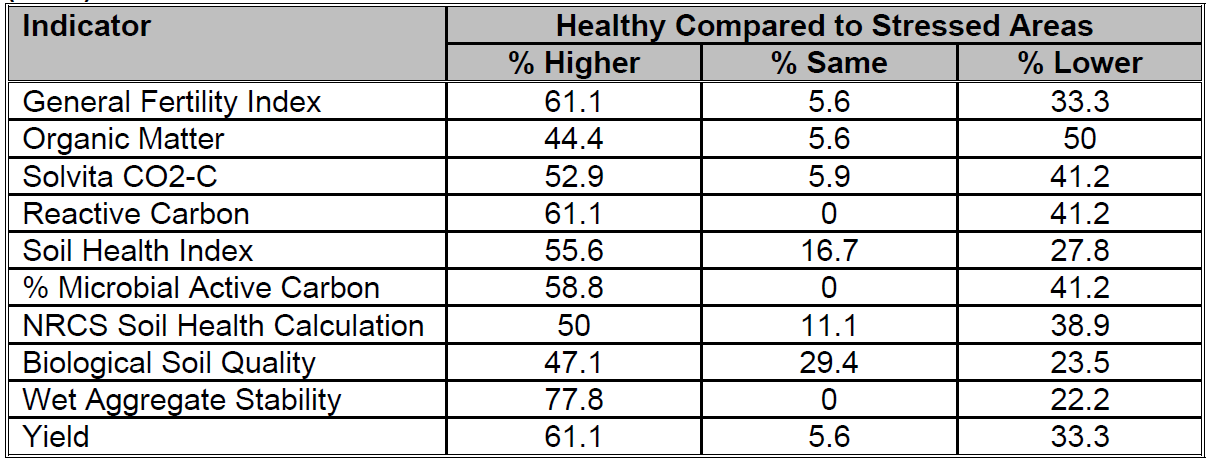
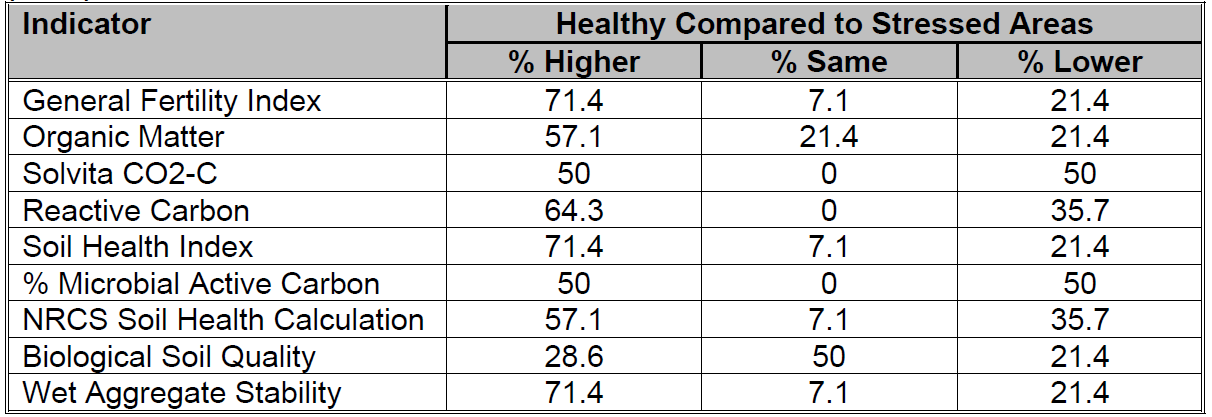
Table 4 below lists several soil health indicators comparing healthy areas to stressed areas. For the 2020 sites general fertility index, organic matter, reactive carbon, Soil Health Index, NRCS soil health calculation and wet aggregate stability appear to be valid soil health indicators with more than half of the “healthy” areas displaying higher values than the “stressed” areas.
Table 4. Soil Health Indicators of Healthy Areas Compared to Stressed Areas (2020)
Summary
Each year of this project experienced some challenges from disease to weather to equipment malfunctions and a pandemic.
Soil health as it relates to yield is complicated. Underlying soil conditions; soil type, topsoil depth, compaction and others all influence yield potential in a field. As we saw in 2019 NDVI imagery is a snapshot in time of crop conditions. Weather through the remainder of the summer determines in part the eventual impact on crop yield.
With time and more experience selecting project sites within fields based on soil type, NDVI imagery and historical yield maps; some of the soil health indicators correlate better with the good areas and hand yields. There is some year to year fluctuation among the indicators but General Fertility Index, Reactive Carbon and Wet Aggregate Stability tests appear the most consistent with the 3 years of data. A larger sample size with greater soil type variation is needed to better understand the relationships and to evaluate the various soil health indicators.
Next Steps
The final statistical analysis for the whole project will be completed shortly and the reports shared with cooperators. If continued funding is available the new Soil Health Assessment and Plan (SHAP) process will be applied in addition to the Vitellus test to evaluate the connection to yield.
Acknowledgements
Thanks to the cooperators who provided the fields and additional information for the plots. Thanks to Warriner Ag for donating their time to provide the field boundaries and for the collection and processing of the yield data in the first two years of the project. The NDVI imagery and additional help in 2020 especially by AGRIS Co-operative staff was greatly appreciated. Thank you to Laura Van Eerd U of G, RC for the use of her lab and for her help in data analysis. To OMAFRA summer students Cassandra Smids, Matt Vermey, and Nicole Litwin thank you for help with sampling and signing the fields and running the aggregate stability samples. Thank you to Adam Hayes for his help with the first year and a half of the project, before retirement. And finally, a huge thank you to A and L Laboratories for their guidance on the project, analysis of the data and especially for the in-kind donation of the DNA analysis of the roots.
Project Contacts:
Anne Verhallen, OMAFRA (anne.verhallen@ontario.ca)
PDF - Soil Health as it Relates to Yield (CLICK HERE)
Notes on the indicators:
General Fertility Index - is an index algorithm that is an overall calculation of field fertility based on the soil’s nutrient composition. The soil nutrient optimum levels are based on soil type. The ranges of GFI Index are VL 0-35, L 35-55, M 55-65, G 65-80, H> 80
Solvita CO2-C (1 day burst) - This is the amount of CO2-C released in 24 hours from soil microbes after your soil has been dried and rewetted (as occurs naturally in the field). This is a measure of the microbial activity in the soil and is highly related to soil fertility. In most cases, the higher the number, the more fertile the soil.
Reactive Carbon – or active carbon is composed of all the dead and actively decomposing organic matter plus all the living soil microbial community that will eventually die and begin decomposing. Reactive Carbon ranges based on the Cornell Assessment of Soil Health in ppm of Active Carbon for a medium Textured soil are Very Low 0-400, Low 400-500, Medium 500-600, High 600-700 and Very High >700.
Soil Health Index – an algorithm developed by A&L that considers the different chemical and physical parameters of the soil. This index ranges from 0 to 60 and highly correlates to yield and the presence of a combination of disease suppressive and bio-stimulating organisms in the plant microbiome (root zone).
% Microbial Active Carbon – %MAC – microbial active carbon is a measurement of how efficiently your soil microbes are using the carbon you are providing and can track the effects of changes in management and the impact of crop rotation and cover crops plus other soil amendments. %MAC = (Solvita 1 day burst CO2/Organic Carbon) x 100
NRCS Soil Health Calculation – uses Solvita CO2-C, C:N ratio and 2 other indicators