Objective
The objective of this work is to test how the A&L laboratories’ VitTellus soil health analysis corelates with the yield and plant performance of corn in Ontario.
Methods
A&L received 30 corn roots with their respective root ball soil for analysis. These samples were collected by OMAFRA, Ridgetown office from three corn fields in South-Western Ontario. Five plants were sample from each site based on NOVI maps identifying the locations as producing high yields or low producing areas for a total of 10 plants per field. The roots with their attached soil were code labelled, packaged individually, and sent to A&L for analysis (Table 1 ).
Table 1. List of samples received for analysis
Upon receiving the samples, the soil was separated from the roots and sent for the VitTellus soil health analysis. A total of 30 soil samples were analysed. The roots from all 3 fields were washed with tap water, chopped into small pieces, and their DNA was extracted. The DNA was used to compare the root microbial communities (bacteria and fungi) of plants from the two areas within each field.
Soil Health Analysis:
The VitTellus soil health uses the chemical parameters of the soil and some biological properties to calculate a relative Soil Health Index (SHI). This index ranges from O to 60, and the health of the soil is ranked as follow:
- SHI 0-20: very low soil health,
- SHI 20-30: low soil health,
- SHI 30-40: mediocre soil health,
- SHI 40-50: good soil health, and
- SHI 50-60: very good soil health
The VitTellus soil health test provides growers with an optimal range for crop productivity of chemical factors that our research has shown to be directly correlated with yield and those microbial activities favourable to plant health.
Analysis of the microbial communities:
The root’s microbial populations were analysed by Terminal Restriction Fragment Length Polymorphism (TRFLP). TRFLP is a fingerprinting technique for monitoring composition of microbial communities and it can be used to track spatial and temporal shifts in microbial populations. Briefly, a conserved region of DNA extracted from roots (16S rRNA gene for bacteria and ITS gene for fungi) were amplified with fluorescently labeled primers. The fluorescent PCR products were then digested with a restriction enzyme. The size and quantity of the fragments were determined using capillary electrophoresis. The banding pattern obtained provides a fingerprint of the microbial community. The relationship of such fingerprints to one another was identified using a multivariate statistical technique called Principle Component Analysis (PCA). Principle Components (PC) are statistical values generated to best explain the variation in a set of samples. TRFLP data were transformed into binary data (is a specific peak present (1) or not (0)) before performing PCA. PCA analysis clustered the data based on similarity of peak presence; 95% confidence intervals were automatically drawn around each sample group. Groups that do not overlap are considered statistically different in their microbial community.
Yield:
Yields were determined by OMAFRA, Ridgetown by hand harvesting the same areas from where the mid season samples were collected. Final yields were kindly provided to us by Anne Verhallen, Soil Management Specialist (Horticultural Crops), Ontario Ministry of Agriculture, Food and Rural Affairs, Ridgetown, Ontario.
Results
Field 1
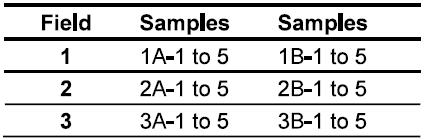
Site B produced 19.5 bu/ac more than site A (site B: 249.2 bu/ac vs. site A 229. 7 bu/ac). A summary of the soil chemical analysis and yield of field 1 is presented in Table 2 (raw data can be found in the appendix).
Both sites in this field had very similar soil chemistry. Both sites had good levels of organic matter (3.54 and 4.06), a good GFI (67.4 and 64.4), moderate SHI (35.6 and 34.2), ideal biological soil quality (4), high levels of reactive carbon (750.8 and 752), and good soil pH (pH 6.74 and 6.82).
Both sites had high levels of magnesium (289.6 and 337 ppm) and low K/Mg ratios (0.162 and 0.12). Our previous research has shown that a K/Mg ratio between 0.25 and 0.35 is ideal for crop productivity. Potash application should benefit the productivity at both sites.
Site B had slightly higher levels organic matter (4.06 vs 3.54), higher Solvita CO2-C (76ppm vs 67ppm) and slightly higher % microbial active carbon (60.5 vs 53.92). Solvita CO2-C measures the microbial activity in the soil and highly related to soil fertility. The differences in these parameters may have provided a yield benefit to this site.
Overall, the chemical profiles of the two soils are remarkably similar and the yield differences were not likely statistically significant.
Table 2. Soil Analysis of Field 1
Microbial communities
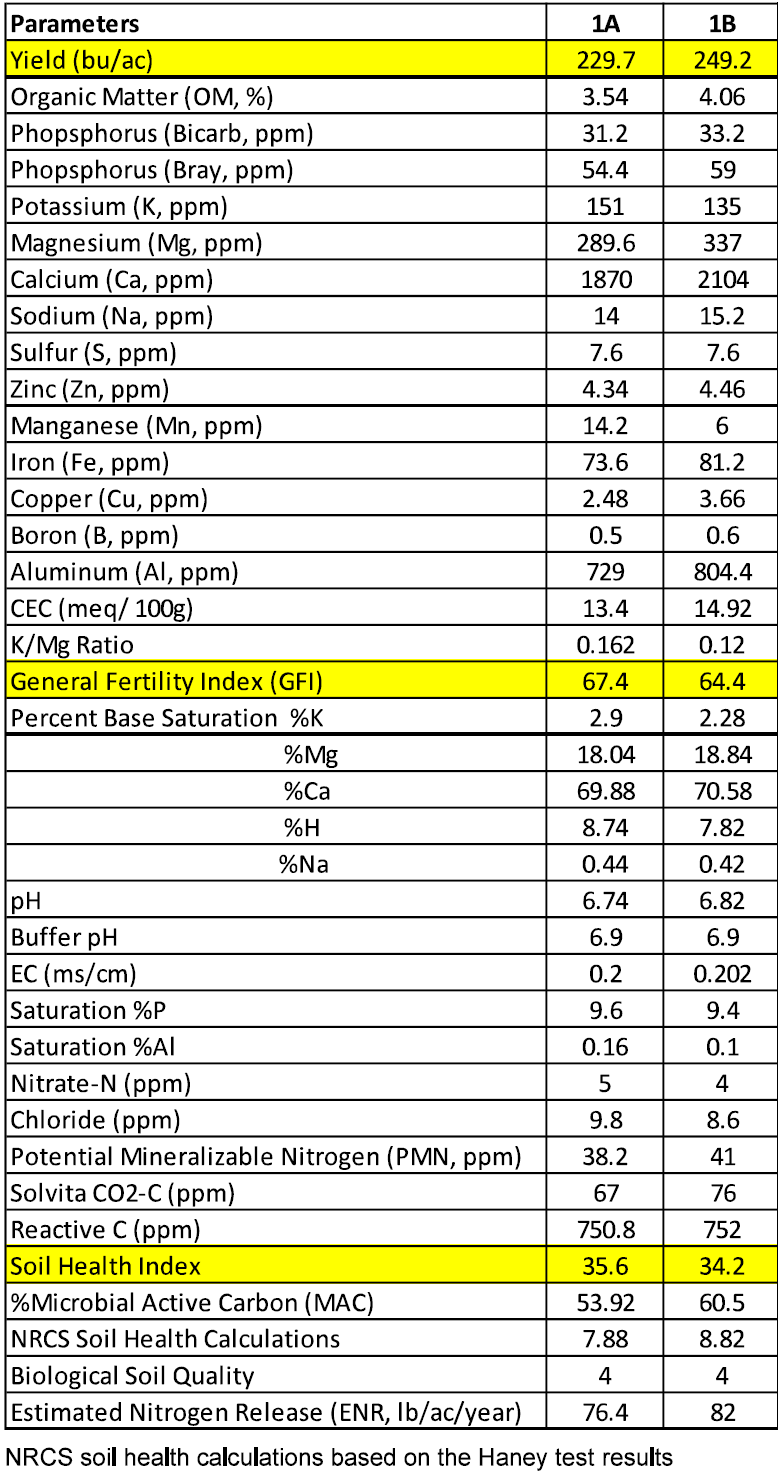
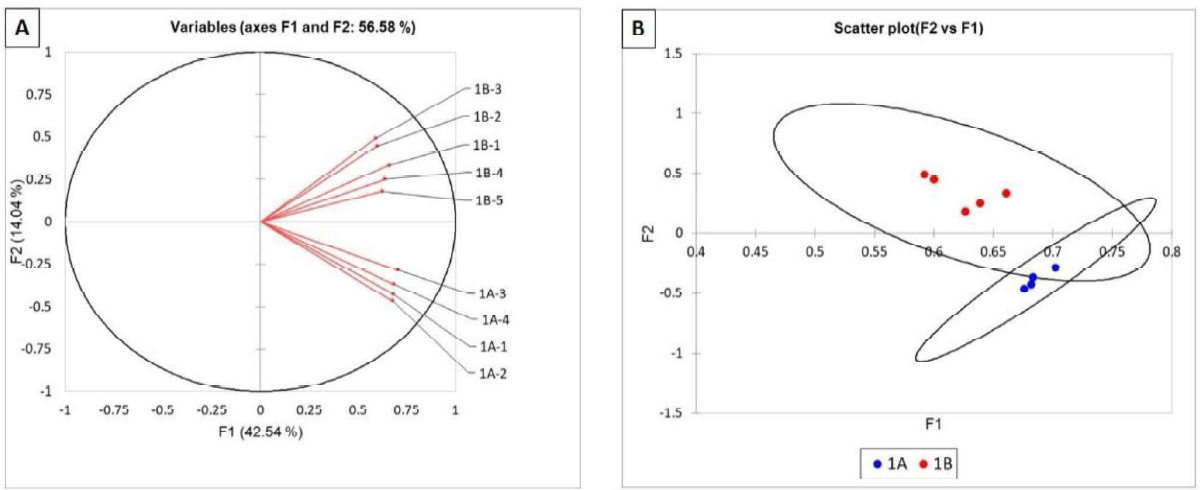
The composition of the bacterial and fungal communities of roots from sites A and B were analysed using TRFLP. We compared the microbial communities from both sites and summarized the results in two different ways: (A) As vectors: Figures 1A and 2A show each TRFLP result as a vector (bacterial and fungal, respectively). Each vector represents the community of one plant (named 1- 5). The closer the vectors are to each other, the more similar are the populations they represent. (B) As single data point: To visualize if there were any statistically significant differences between the communities from site A and B, we summarized our results as single data points and plotted them two dimensionally (Figures 1 B and 2B). The degree of separation between dots indicates the extent of similarities or differences. The further the dots are separated, the greater the difference. The closer they are, the more similar the population. Confidence circles (95%) that do not overlap are considered significantly different.
No differences in the bacterial communities of roots from site A and B were found (Figure 1A and B). All samples clustered together indicating that their bacterial communities were similar.
Figure 1. Statistical analysis of TRFLP of the bacterial communities in corn roots of field 1. Bacterial communities are represented as vectors (A) and as points with 95% confidence circles (B).
As shown on Figure 2A, the vectors of the fungal communities of the roots from site A were all grouped below the Oline whereas those from site B were all above. The cluster analysis grouped all the A components close to each other and the B components samples were also closely related (Figure 1 B, data as single points). This indicates that the fungal communities from site A and B were different, but the differences were not statistically valid as indicated by the overlapping confidence circles (Figure 2B). At the same time this is indicative of that some clear differences in the fungal communities exist at the two locations.
Figure 2. Statistical analysis of TRFLP of the fungal communities in corn roots of field 1. Fungal communities are represented as vectors (A) and as points with 95% confidence circles (B).
Field 2
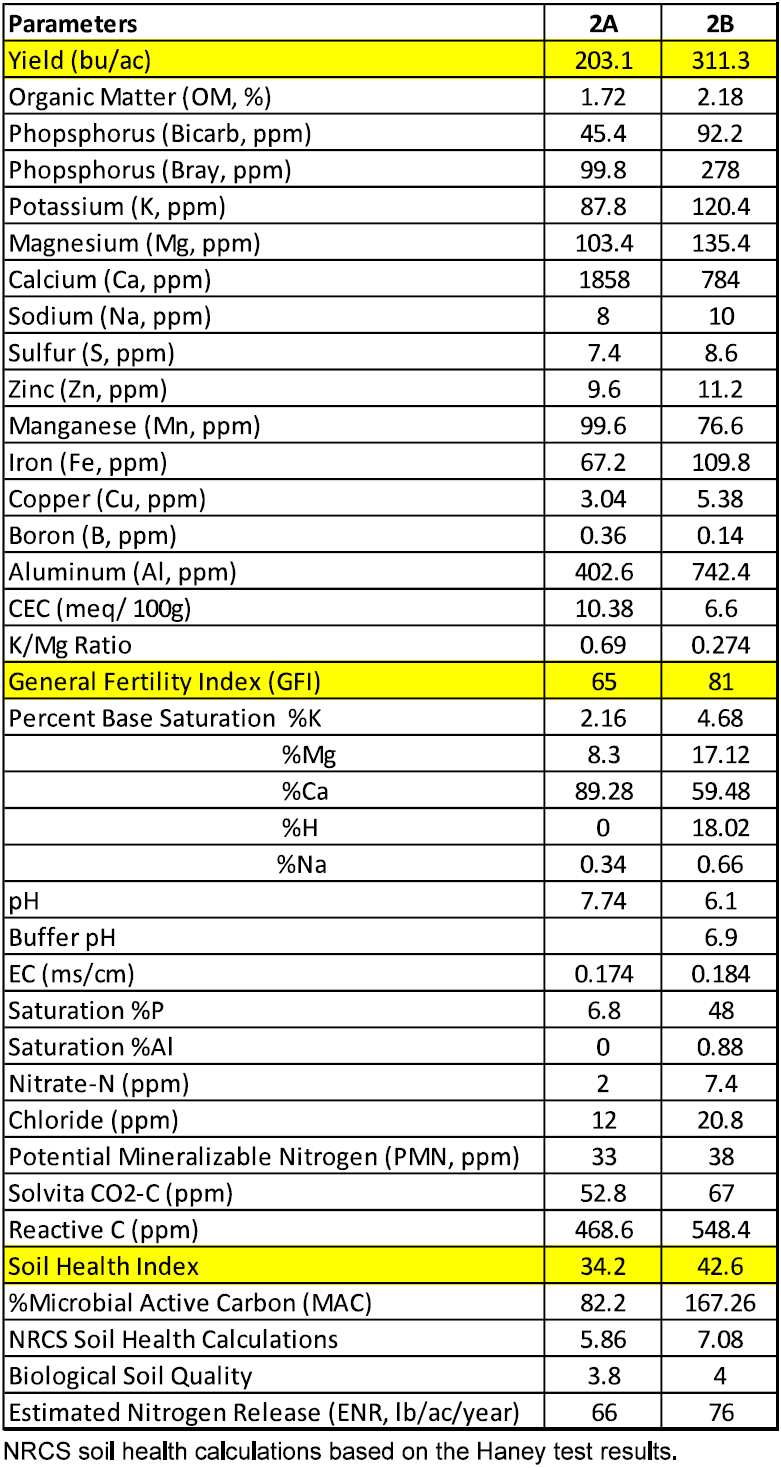
Site B produced 108.2 bu/ac more than site A (site B: 311.3 bu/ac vs. site A 203.1 bu/ac). A summary of the soil chemical analysis and yield of field 2 is presented in Table 3.
In this field site B had a higher organic matter content (2.18% vs. 1.72%), phosphorus (Bicarb 92.2 ppm vs. 45.4 ppm; Bray 278 ppm vs. 99.8 ppm), potassium (120.4 ppm vs. 87.8 ppm), percent saturation potassium (4.68% vs. 2.16%) and percent saturation magnesium (17.12% vs. 8.3%). For this soil type, the percent saturation of potassium in site B falls above the ideal range while site A is below the ideal range. Similarly, site B had a good level of phosphorus while site A had mediocre levels. The percent saturation magnesium for site B fell within the ideal range for this soil type whereas site A fell below the ideal range. Our previous research has shown that a K/Mg ratio between 0.25 and 0.35 is ideal for crop productivity. In this field, site B had K:Mg ratios that fell withing the ideal range and site A had K/Mg ratios that were higher than the ideal range. Any deviations from the ideal K:Mg range either lower or higher can have negative impacts on crop productivity.
Site B had a higher GFI (81 vs. 65) and SHI (42.6 vs. 34.2) than site A. The general fertility index (GFI) is a calculation of field fertility based on soil nutrient levels and soil type. It is strongly correlated to yield, field performance and beneficial microbes. The GFI value for site B is considered good/high compared to that of site A which is considered moderate/good. The SHI for site Bis considered good and the SHI for site A is considered moderate.
Site B had higher levels of reactive carbon than site A (548.4 ppm vs. 468.6 ppm).
Reactive Carbon is more complex than the Labile Carbon in that its composed of all the dead and actively decomposing organic matter plus all the living soil microbial community that will eventually die and begin decomposing. Reactive carbon is linked to a number of soil processes, including microbial biomass growth and activity and nutrient cycling. Reactive carbon changes in soils can happen very quickly and a significant decrease in reactive carbon may signal a decline in soil organic matter and indicate the deterioration of physical, chemical, and biological properties and processes related to soil organic matter. The adverse effects caused by the decline in reactive carbon include reduced aggregate stability, increased bulk density, and reduced water infiltration, water-holding capacity, microbial activity, and nutrient availability. Reactive Carbon ranges based on the Cornell Assessment of Soil Health in ppm of Active Carbon for a medium Textured soil are Very Low 0-400, Low 400-500, Medium 500-600, High 600-700 and Very High >700. According to this scale Site A had low levels of reactive carbon while Site B had moderate levels of it.
The differences observed in the soil chemistry and microbial communities present at each site support the yield result differences at the two locations.
Table 3. Soil Analysis of Field 2.
Microbial communities
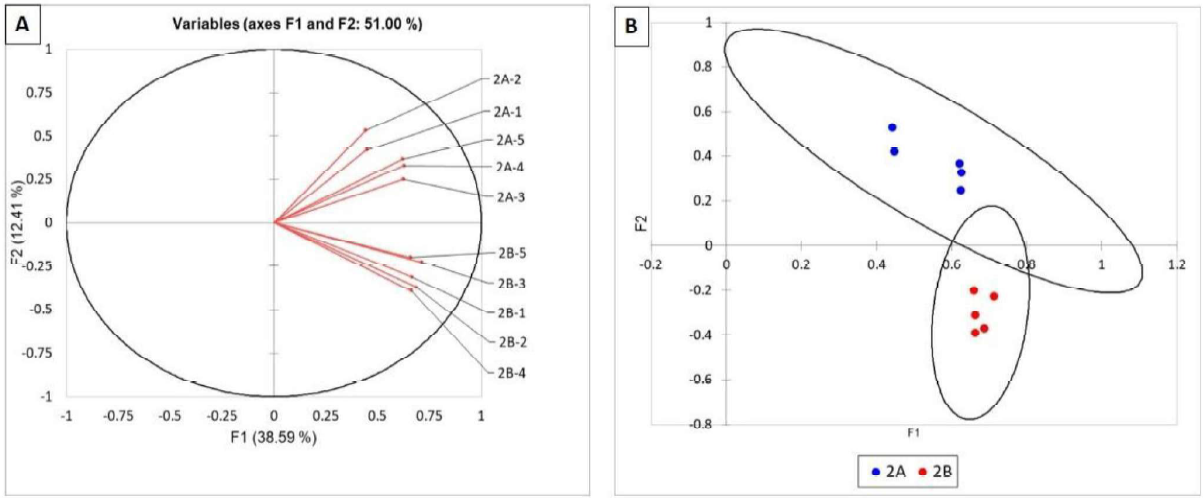
As shown in Figures 3 (A and B), the bacterial communities of the roots from site A were all grouped above the O lines whereas those from site B were grouped below. This indicates that the bacterial communities from site A and B were different, but the differences were not sufficient as to be highly statistically valid as indicated by the overlapping confidence circles (Figure 38). Similar results were observed for the fungal communities of site A and B (Figure 4). The TRFLP results for field 2 indicated that there are clear differences in the both the bacterial and fungal communities between the 2 sites sampled within the field. This is likely impacted by the differences in pH at the two sites (A = 7.74 and B = 6.1). More alkaline soils are bacterial dominant whereas acidic soils are fungal dominant.
Figure 3. Statistical analysis of TRFLP of the bacterial communities in corn roots of field 2. Bacterial communities are represented as vectors (A) and as points with 95% confidence circles (B).
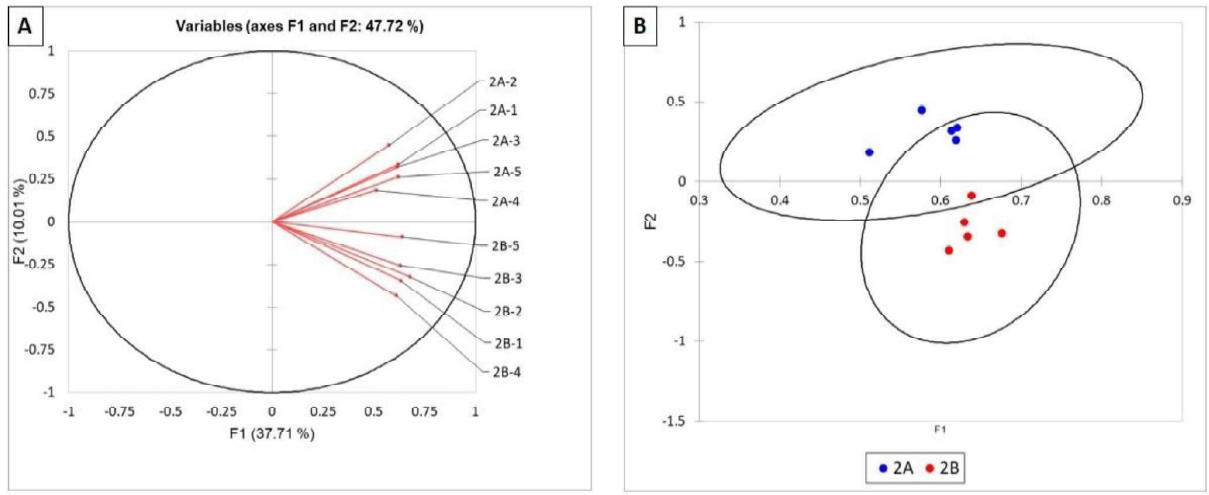
Figure 4. Statistical analysis of TRFLP of the fungal communities in corn roots of field 2. Fungal communities are represented as vectors (A) and as points with 95% confidence circles (B).
Field 3
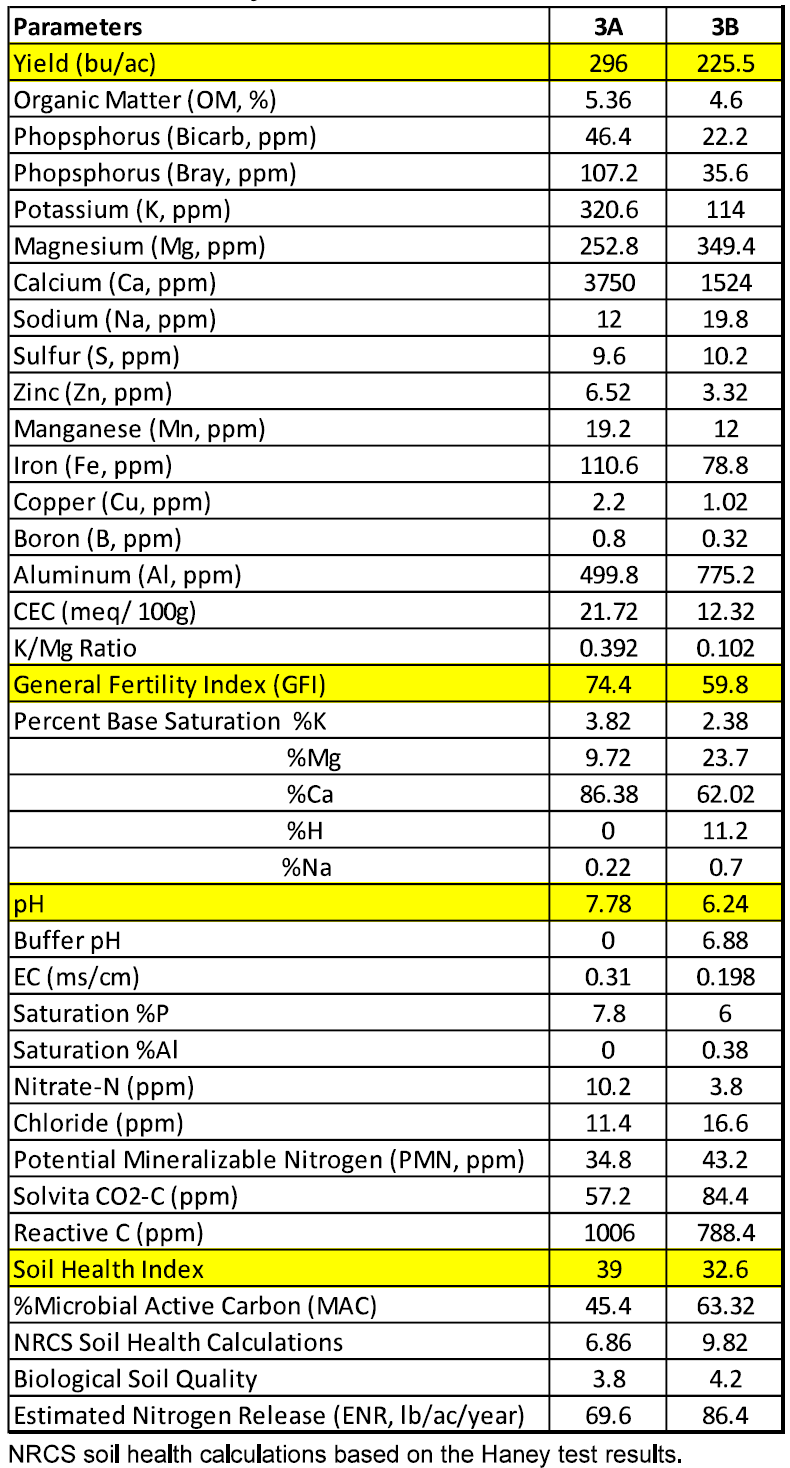
Site A produced 70.5 bu/ac more than site B (site A: 296 bu/ac vs. site B 225.5 bu/ac). A summary of the soil chemical analysis and yield of field 3 is presented in Table 4.
In this field site A had a higher organic matter content (5.36% vs. 4.6%), phosphorus (Bicarb 46.4 ppm vs. 22.2 ppm: Bray 107.2 ppm vs. 35.6 ppm), potassium (320.6 ppm vs. 114 ppm), and percent saturation potassium (3.82% vs. 2.38%) than site B. For this soil type, the percent saturation of potassium in site A and B both fall within the ideal range and the levels of phosphorus were considered good for site A and mediocre site B.
Site A had a higher GFI (74.4 vs. 59.8) and SHI (39 vs. 32.6) than site B. The GFI value for site A is considered good compared to that of site B which is considered moderate. The SHI values for site A and B are both considered moderate.
Site A had higher levels of reactive carbon than site B (1006 ppm vs. 788.4 ppm) although both sites were considered to have high levels of reactive carbon.
The differences observed in the soil chemistry and microbial communities present in each site support the yield results at the two locations.
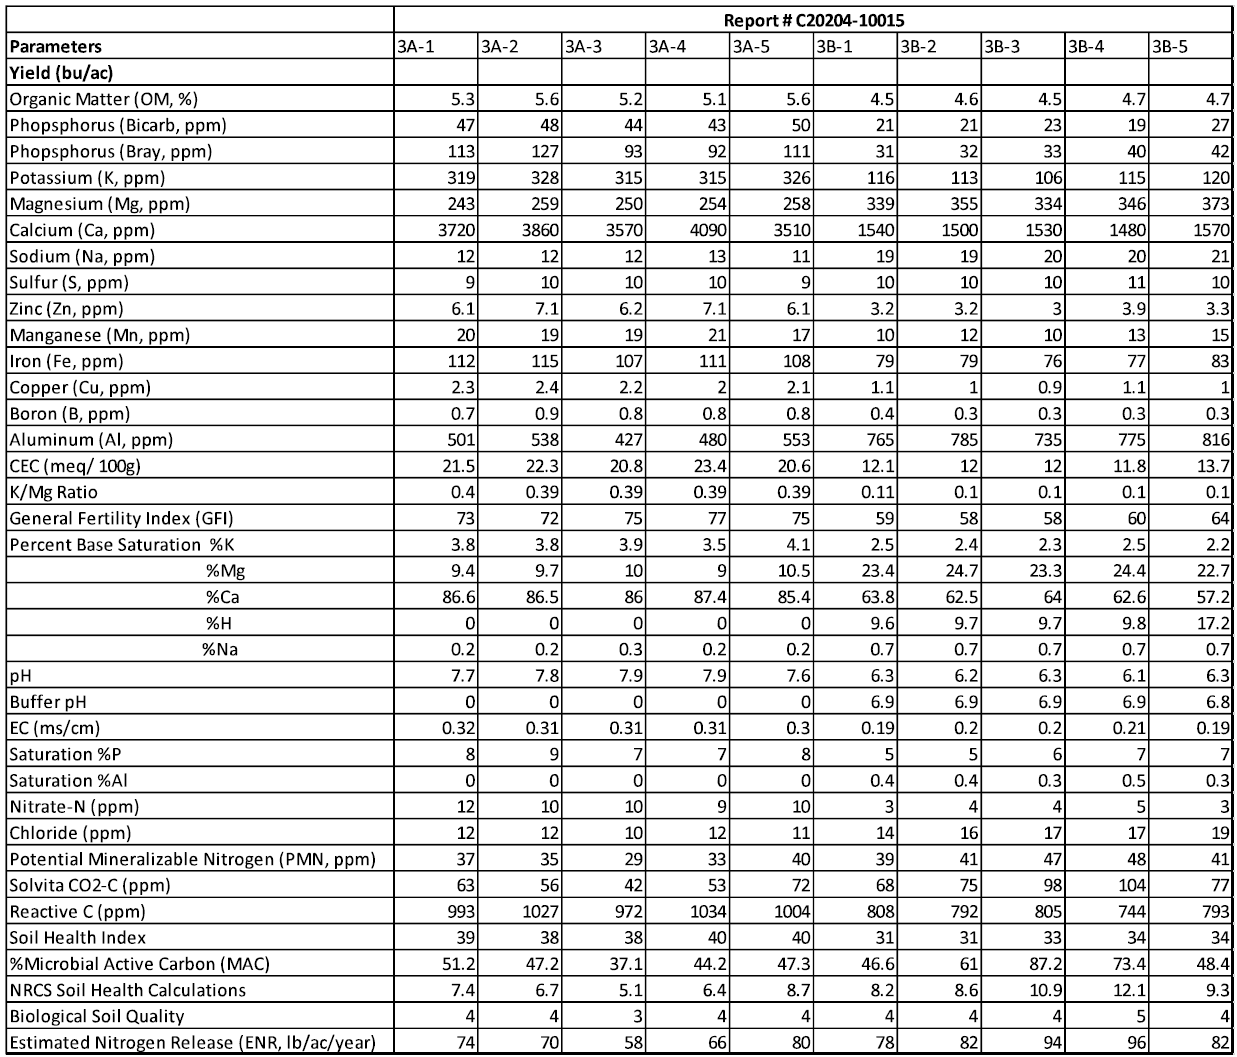
Table 4. Soil Analysis of Field 3.
Microbial communities
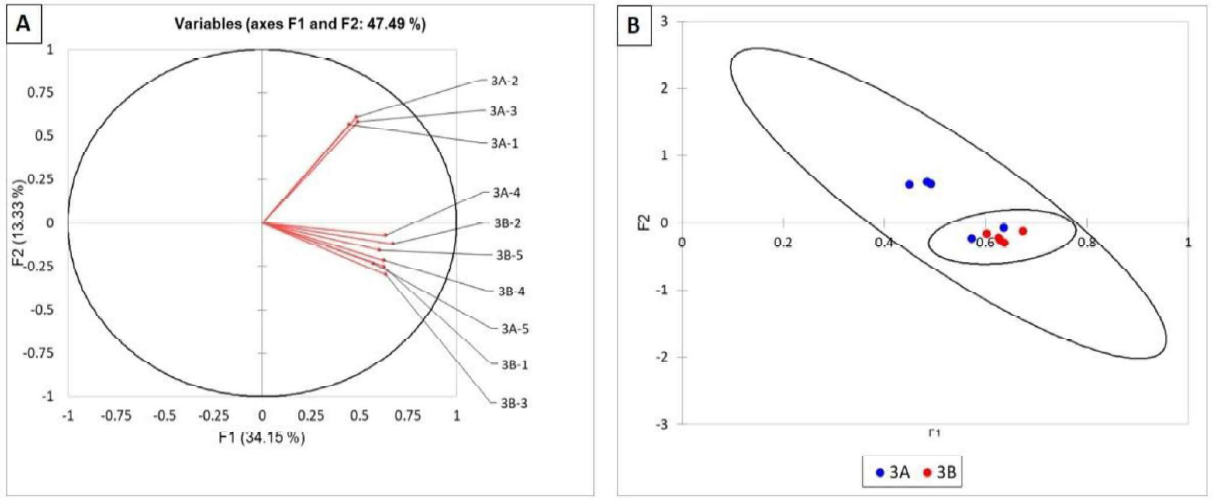
No differences were found in the bacterial communities of roots from sites A and 8 in this field (Figures SA and 8).
Figure 5. Statistical analysis of TRFLP of the bacterial communities in corn roots of field 3. Bacterial communities are represented as vectors (A) and as points with 95% confidence circles (B).
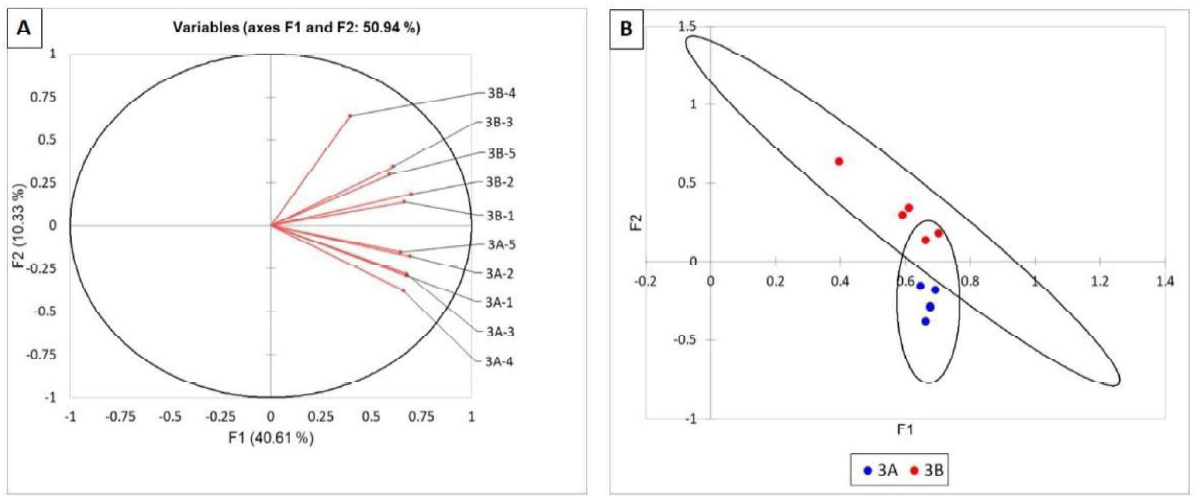
In contrast, the vectors of the fungal communities of the roots from site A were all grouped below the Oline whereas those from site 8 were all above (figure 6A). The cluster analysis grouped all the A components close to each other and the 8 components samples were also closely related (Figure 68, data as single points). This indicates that the fungal communities from site A and 8 were different, but the differences were not sufficient as to be highly statistically significant as indicated by the overlapping confidence circles, Figure 68). At the same time this is indicative of that some clear differences in the fungal communities exist at the two locations again likely the result of pH effects.
Figure 6. Statistical analysis of TRFLP of the fungal communities in corn roots of field 3. Fungal communities are represented as vectors (A) and as points with 95% confidence circles (B).
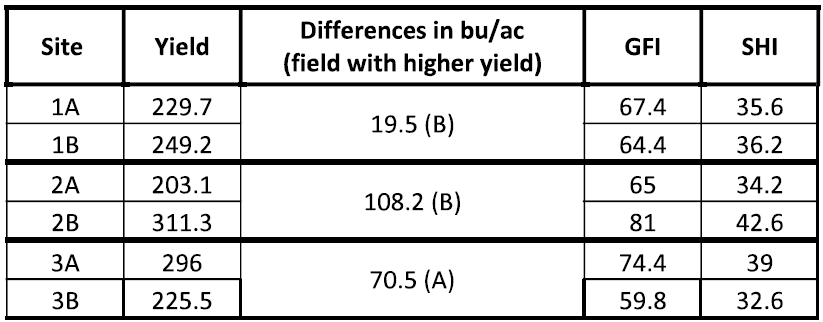
Summary of Results (Table 5)
- Sites with different productivity level were successfully identified at all 3 fields studied (100% success, differences bigger than 5 bu/ac).
- Higher General Fertility index (GFI) and Soil Health Index (SHI) correlated with higher yields on 2 of the 3 fields.
- The Soil health Index predicted the 2 sites having the greatest yield differences (fields 2 and 3). Site 1 with lower yield differences (less than 20 bu/ac) had similar GFI and SHI values.
- Microbial population differences were reflected in soils with the greatest yield differences.
VitTellus is a Soil Health Test which assesses the chemical, physical and biological balance of the soil, and leads to agronomic strategies to improve soil health which drives greater nutrient utilization, higher crop yields and greater farm profitability.
This study provides clear evidence of the site variability in yields that if addressed could help growers produce better crops.
Table 5: Summary of Results
Conclusions
The soil health test gives a complete overview of the chemical status of a soil and allows us to identify the differences between different production areas. It also provides growers with the optimal ranges of those chemical factor that highly correlate with yields and beneficial microbial activities.
PDF - Soil Health Analysis of Corn Fields (CLICK HERE)
Appendix
The tables presented below correspond to the summary of the results of the soil chemical analysis.
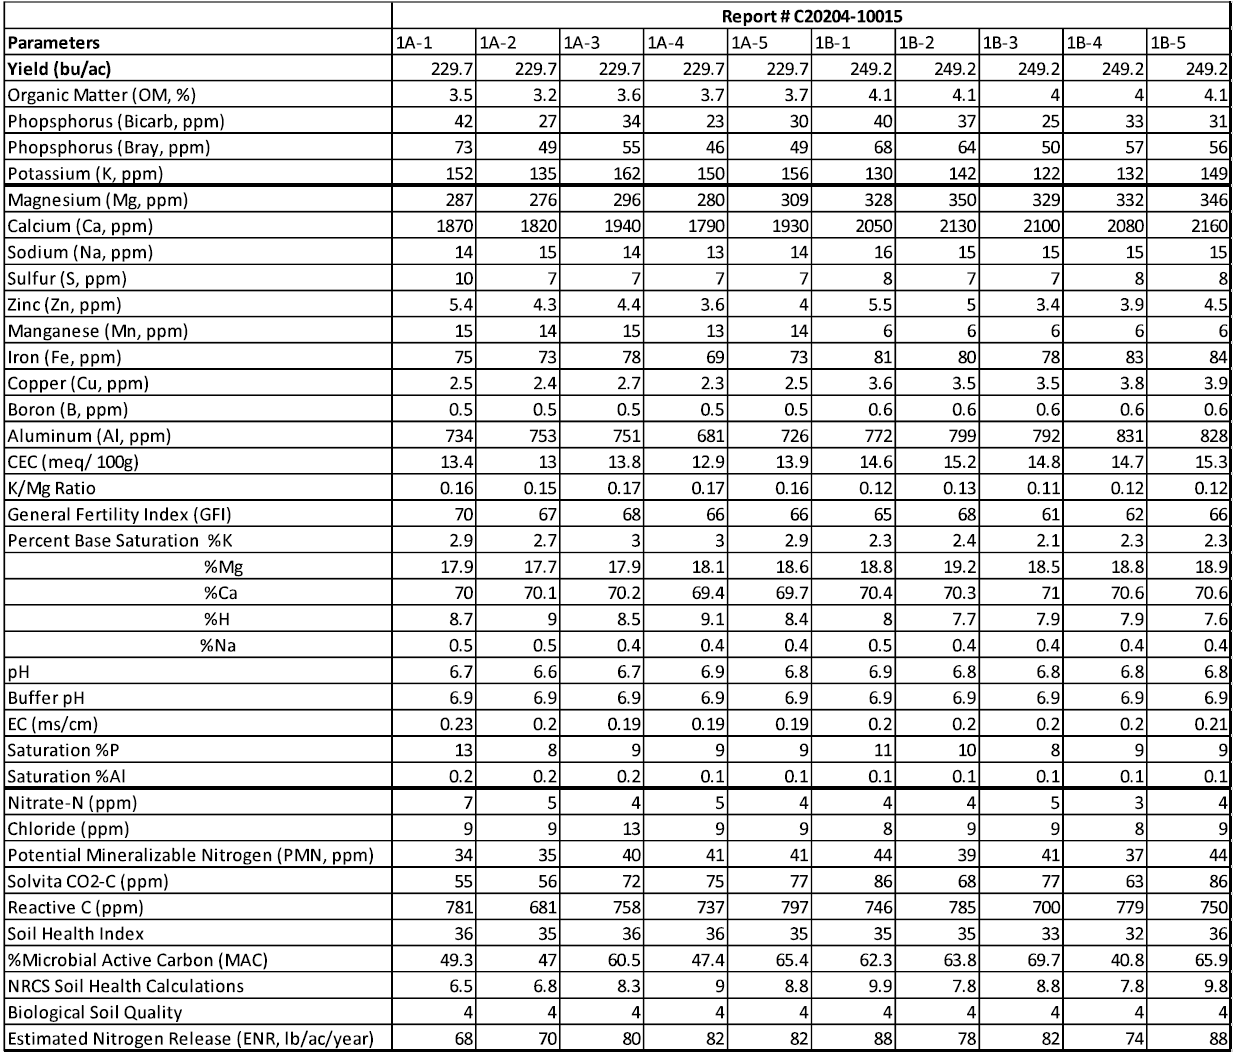
Field 1: Chemical Analysis
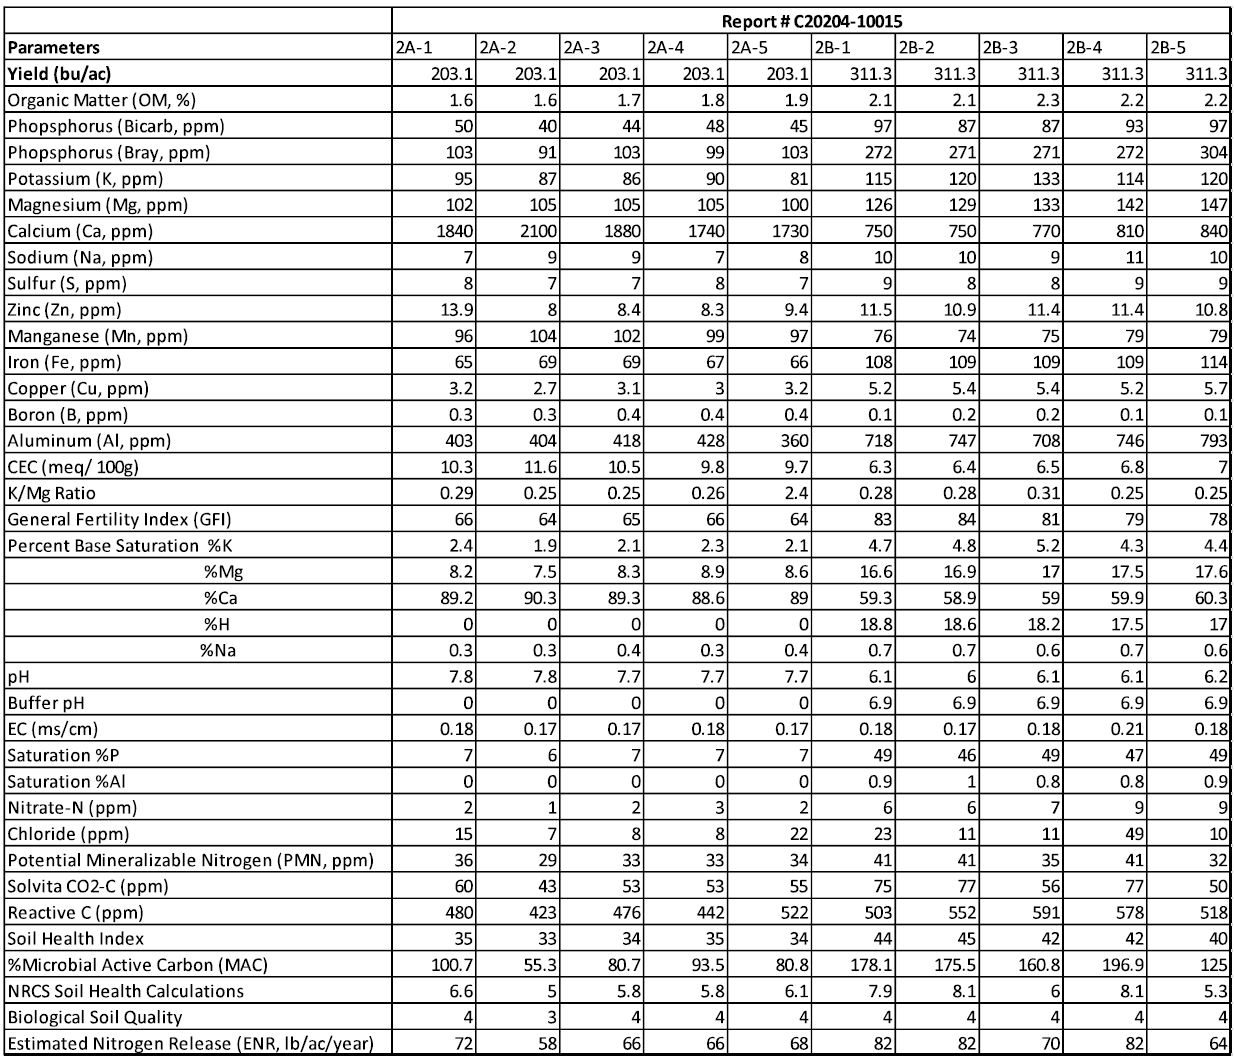
Field 2: Chemical Analysis
Field 3: Chemical Analysis