Purpose
To compare A & L Canada Laboratories’ new soil health analysis to yield and plant performance.
Methods
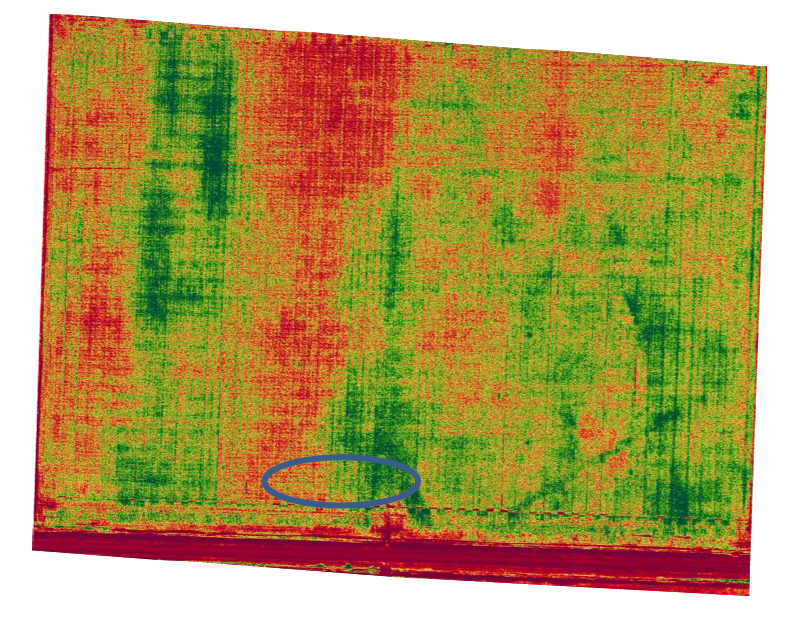
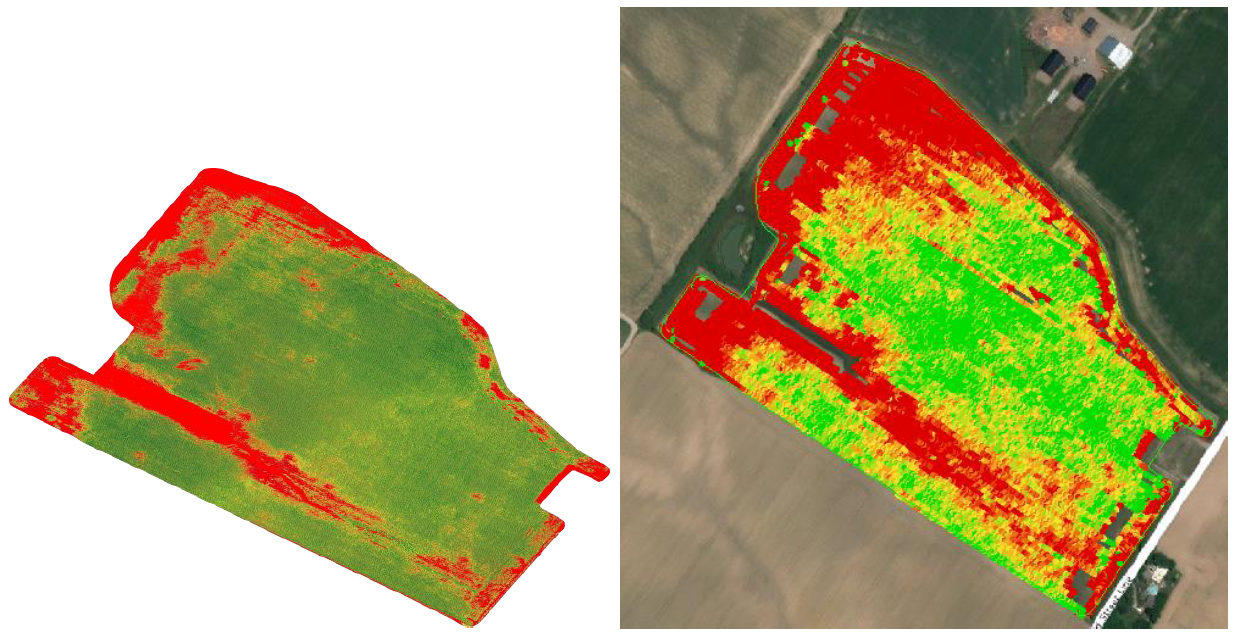
Each year of the project up to seven co-operators from each county (Lambton, Kent, Essex) will provide corn fields to be sampled. The cooperators must have a combine yield monitor and be able to generate yield maps for the field. Field location information is collected and sent to Warriner Ag. The location information is used to create field boundary maps. The maps are used by AGRIS Co-operative to have aerial imagery flown using Normalized Difference Vegetation Index (NDVI) technology for each field, see figure 1. This took place once the corn had reached the V10 stage (10 leaf collars) and no later than the R1 growth stage (silking – silks emerging from husks at tip of ear). The imagery was used to identify areas of the field that are healthy and areas that are stressed.
Figure 1. Normalized Difference Vegetation Index (NDVI) Map showing where the samples were taken from (green areas represent healthy areas and red indicates stressed areas).
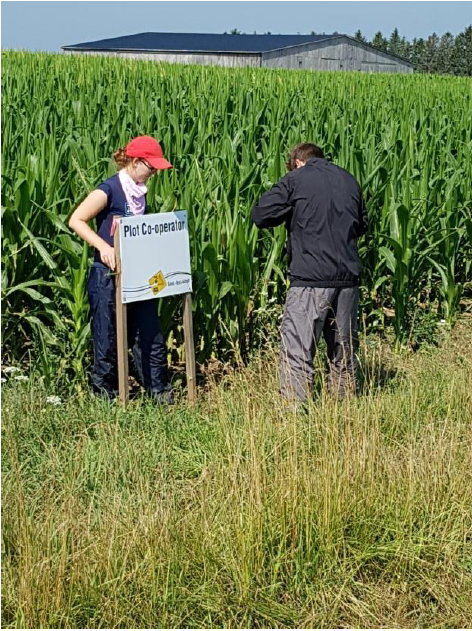
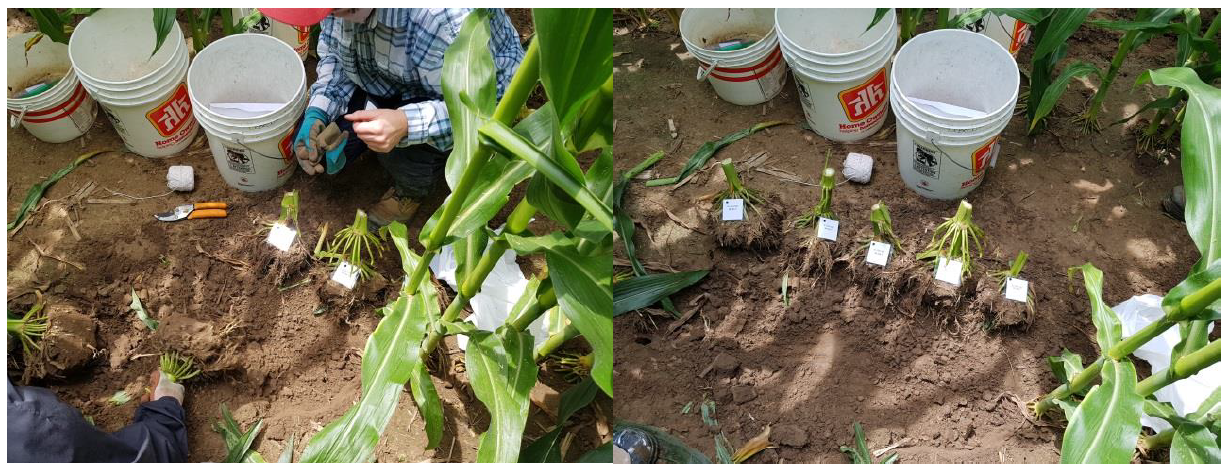
One stressed area and one healthy area were sampled in each field. At each sampling point 5 corn root balls were dug up and individually bagged and tagged, see figure 2. The letters A and B were randomly assigned to the healthy and stressed samples. The growth stage of each plant, sample date and GPS coordinates were recorded. Twenty soil cores (six inch depth) were taken for fertility and aggregate stability analysis. The soil and root balls were sent to A & L Laboratories with in a day or two of sampling. The soil sample was analyzed for fertility. Soil from the root ball was analyzed using the A & L Laboratories soil health test Vitellus and a portion of the root from each root ball was analyzed to assess the microbial community. The aggregate stability analysis was completed in Dr. Laura Van Eerd’s lab at University of Guelph Ridgetown Campus using the automated wet sieving method by an Ontario Ministry of Agriculture, Food and Rural Affairs (OMAFRA) summer student.
Figure 2. The root balls are tagged and ready to be bagged and sent to the lab.
Just prior to harvest, corn cobs were harvested from two rows (1/1000 of an acre per row) adjacent to each of the sample points in each field. The samples were shelled and hand harvest yields were calculated for each sample point. Each co-operator harvested their field using a combine equipped with a GIS capable yield monitor. Yield data for an area 30’ long by the width of the combine for each sample point was used to compare yield to the soil health and root microbial analysis.
Basic crop information was collected as well as soil management history for each field. This provides background on management practices which then can be used to understand if any specific BMP’s along with any soil health test characteristics lead to higher yields and healthier soils.
Results
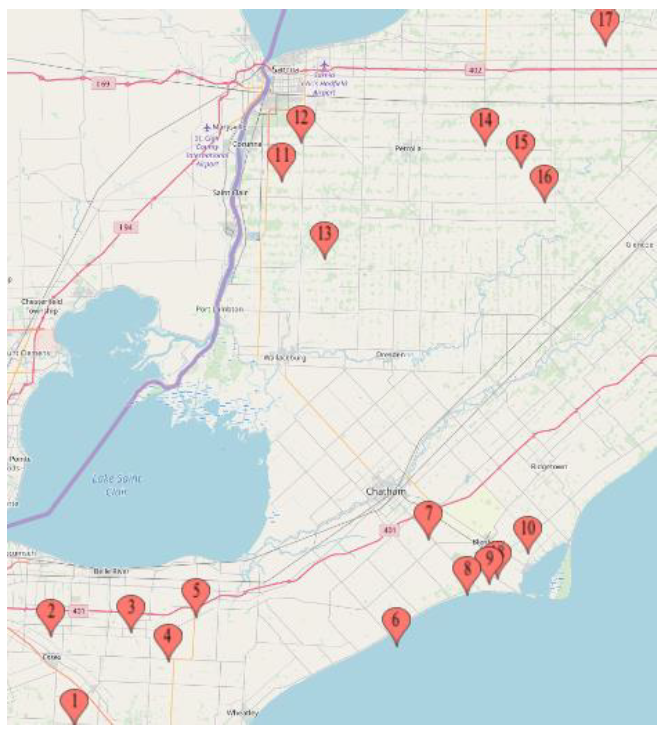
2018 was the first year of this project. 17 soil and crop members volunteered fields for the project. There was a pretty good distribution of fields from west Essex county to north Lambton county, see figure 3. Most fields were clay, clay loam or silty clay loam soils with one being a loam soil. It was a challenging year to start the project as the wet spring delayed planting for many and then it turned dry in many areas. The delayed planting made it difficult to know when the fields would be ready to be flown for the NDVI. Some of the NDVI maps did not show a lot of differences in the field making it difficult to choose healthy and stressed spots in the field.
Figure 3. Map of 2018 Cooperator fields.
Most of the fields had fairly similar hand yields between the sites A and B selected for this study. On seven out of the seventeen fields studied, the differences in yield between the sites A and B were less than 10 bu/ac; on five fields the differences in yields between sites A and B were between 10 and 20 bu/ac; and in only four fields were those differences more than 20 bu/ac. One of the fields was harvested before hand yields could be taken.
The fall proved to be challenging as well. Two of the fields were not combined due to high levels of DON. Some of the other fields were later being harvested (into January) due to wet field conditions. Other challenges included data gaps in yield maps where the samples had been taken. Figure 4 shows some fairly good similarities between the NDVI map and the combine yield map.
Figure 4. NDVI map flown on July 18, 2018 on the left and the yield map on the right.
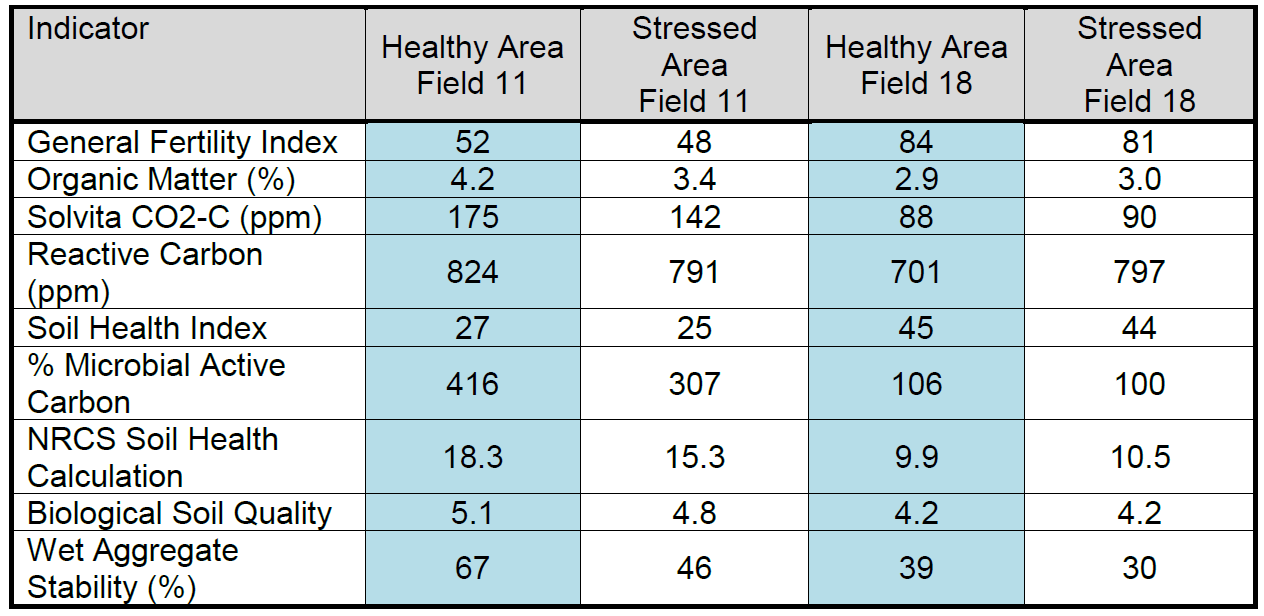
The soil around the roots was analyzed using the A & L soil health test. Overall eight of the fields showed higher numbers for several soil health indicators where the samples were taken from healthy areas. Table 1 is an example of some of the soil and fertility data generated for each field location.
Table 1. A selection of soil health indicators for two of the fields.
Notes on the indicators:
General Fertility Index - is an index algorithm that is an overall calculation of field fertility based on the soil’s nutrient composition. The soil nutrient optimum levels are based on soil type. The ranges of GFI Index are VL 0-35, L 35-55, M 55-65, G 65-80, H> 80
Solvita CO2-C (1 day burst) - This is the amount of CO2-C released in 24 hours from soil microbes after your soil has been dried and rewetted (as occurs naturally in the field). This is a measure of the microbial activity in the soil and is highly related to soil fertility. In most cases, the higher the number, the more fertile the soil.
Reactive Carbon – or active carbon is composed of all the dead and actively decomposing organic matter plus all the living soil microbial community that will eventually die and begin decomposing. Reactive Carbon ranges based on the Cornell Assessment of Soil Health in ppm of Active Carbon for a medium Textured soil are Very Low 0-400, Low 400-500, Medium 500-600, High 600-700 and Very High >700.
Soil Health Index – an algorithm developed by A&L that considers the different chemical and physical parameters of the soil. This index ranges from 0 to 60 and highly correlates to yield and the presence of a combination of disease suppressive and bio-stimulating organisms in the plant microbiome (root zone).
% Microbial Active Carbon – %MAC – microbial active carbon is a measurement of how efficiently your soil microbes are using the carbon you are providing and can track the effects of changes in management and the impact of crop rotation and cover crops plus other soil amendments. %MAC = (Solvita 1 day burst CO2/Organic Carbon) x 100
NRCS Soil Health Calculation – uses Solvita CO2-C, C:N ratio and 2 other indicators
Table 2 below lists several soil health indicators comparing healthy areas to stressed areas. Organic matter, Solvita CO2-C, reactive carbon, % microbial active carbon, NRCS soil health calculation and biological soil quality appear to be valid soil health indicators with slightly half of the “healthy” areas displaying higher values than the
“stressed” areas. Previous soil health research has suggested that aggregate stability is a very good indicator but 2018 data from this project does not support that.
Table 2. Soil Health Indicators of Healthy Areas Compared to Stressed Areas
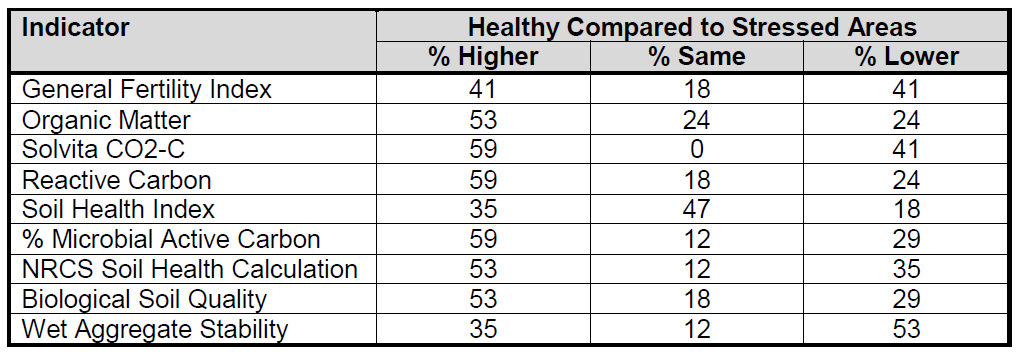
Figure 5. Statistical analysis of the results for the bacterial communities in corn roots for field 4.
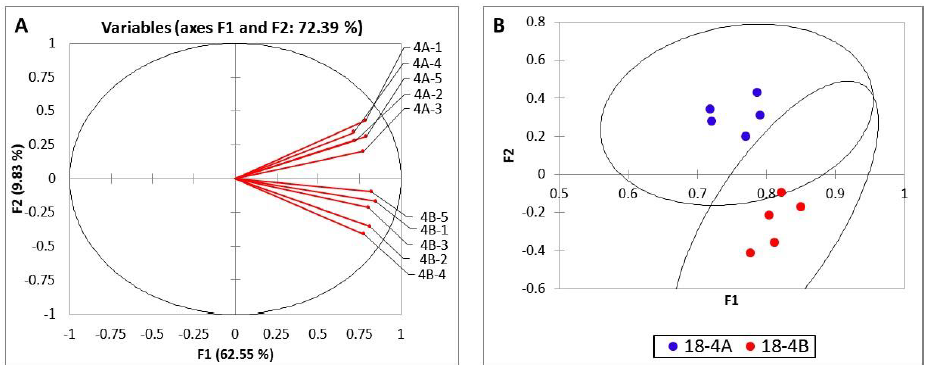
The microbial communities were assessed on the roots of 11 of the 17 fields. Three of the 11 fields show differences in the communities although they were not statistically significant. Figure 5 shows one of the fields where there were some differences. Graph A shows the A root communities are separate from the B communities on the graph. The statistical analysis on graph B shows the blue points separate from the red points but the ovals overlap indicating the communities are not completely different. Figure 6 is a field that did not show any differences. Graph A has a mixture of A and B points above and below the line. The blue and red points are clustered together in graph B and the ovals mostly overlap indicating the communities are the same.
Figure 6. Statistical analysis of the results for the bacterial communities in corn roots for field 9.

Summary
In general the soil health indicators did not correlate well with the hand yields. In many cases the indicators were similar between the healthy and stressed areas or were slightly higher for the bad area. The A and L soil health test is designed to give a complete overview of the chemical and microbial status of a soil and to allow the grower to identify the differences that exist in areas with different productivity levels.
Combine yields are still being received at this time. Further analysis will be completed with the combine yields.
Next Steps
Once all of the yield data is received the yields for the healthy and stressed areas will be pulled from the data and statistical analysis will be completed comparing the soil health indicators to yield. The partners will meet to determine how to better select the areas to sample in a field and if any changes should be made to the sampling and analysis of the two areas in a field for 2019.
Acknowledgements
Thanks to the cooperators who provided the fields and additional information for the plots. Thanks to Warriner Ag for donating their time to provide the field boundaries and for the collection and processing of the yield data. The NDVI imagery supplied by AGRIS Co-operative was greatly appreciated. Thank you to Laura Van Eerd U of G, RC for the use of her lab and for her help in data analysis. To OMAFRA summer students Cassandra Smids and Matt Vermey, and Anne Verhallen for help with sampling the fields. And finally, thank you to A and L Laboratories for their guidance on the project, analysis of the data and especially for the in-kind donation of the DNA analysis of the roots.
Project Contacts
Adam Hayes, OMAFRA, adam.hayes@ontario.ca
Anne Verhallen, OMAFRA anne.verhallen@ontario.ca