Purpose
To quantitatively assess the health of agricultural soils in Renfrew County, and to establish benchmark measurements for future monitoring of soil health trends. The soil health assessment evaluates a suite of indicators of soil physical, chemical, and biological quality. The results of the assessment, along with a producer-completed Farmland Health Checkup, should help to shed light on potentially limiting factors to soil functions and crop production (e.g. poor structure limiting water infiltration) or low-hanging fruit for targeted improvements (e.g. nutrient levels).
Methods
Renfrew SCIA members were invited to participate in the benchmarking project and were offered the cost of one analysis each. Those who wanted to have multiple fields or locations tested could do so at their own cost. Of the 9 participants, 7 found it worthwhile to do so.
Where multiple samples were requested, most decided to sample different fields, choosing to use the project to compare productive and less productive fields to see if the soil health assessment would help to explain the yield differences they experience. The limitation to this approach is that a single point was chosen to represent an entire field, which would not capture in-field variability. The other option was to sample a field and an adjacent fencerow, which could provide a comparison between agricultural and “natural” soil health within a field.
Samples and measurements were taken by OMAFRA staff and students between June 7th and June 9th, 2017. Participants were asked to identify a representative area of each field to be sampled. In these places, the in-field assessment was conducted on a 4 x 6m area. See appendix 1 for a list of analyses currently included in the Ontario Soil Health Assessment.
Thirty 6in (15cm) soil cores were taken from the sample area, mixed together and divided in thirds. The first portion was for lab analysis (phosphorus, potassium, magnesium, manganese, zinc, pH, organic matter and texture). The second part was sent for lab analysis for potentially mineralizable nitrogen (PMN) and the third part was analyzed for aggregate stability.
Other measurements included sampling for nematodes where eight to ten cores were taken from the area for analysis. The top two inches (5cm) of soil were removed and the next six inches (15cm) were sampled. A soil probe was used to take a core of the soil profile to determine the depth of the A horizon. Where a pedologist was present, the soil profile was described to the soil series level. Infiltration measurements were taken using an eight inch (20cm) diameter ring. The ring was driven in the soil leaving about 2.5” (6cm) of the 4” (10cm) height of the ring above the soil surface. A plastic bag was placed over the ring and the soil. The equivalent of an inch (2.5cm) of water was poured onto the plastic. The plastic was removed and the time it took for the water to infiltrate was recorded. This was repeated and the second time was used for the infiltration measure so as to remove the variable of initial moisture. Three penetrometer readings were also taken in each sample area. The global position of the centre point of the sample area was recorded so samples could be taken in the future to measure change.
An additional biological indicator was placed in one of each participant’s fields. A new, washed pair of men’s cotton briefs was buried in the field leaving the waistband exposed.
Cooperators were asked to fill out the Farmland Health Check-up so their practices could be assessed using the assessment part of the check-up. It was used to help interpret the sample results and help to identify practices that could help to improve or maintain the health of a field.
The results of the assessments were given ratings, either categorical (poor to very good) or ordinal (score out of 100), and colour coded for ease of interpretation by participants. An example of how this would look for a single participant with three fields is given in figure 1 (scores provided in parentheses). For some properties, the ratings are dependent on soil texture.
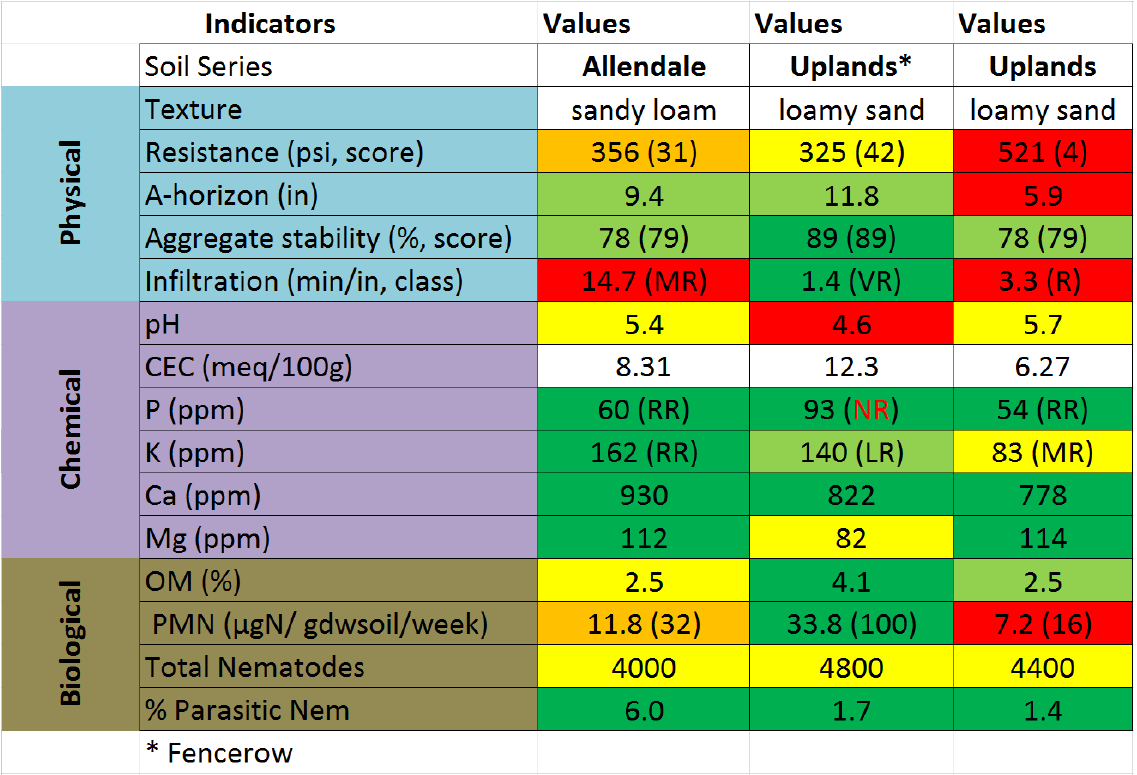 Figure 1. Example of tabulated results from a participant who sampled three fields. Those indicators in red represent potentially limiting factors that should be addressed in priority.
Results
A total of 20 samples were taken on nine cooperators’ farms. Fields sampled represented a fairly wide range of crops, including corn, soybeans, cereals, canola, forage and pasture, and vegetable crops, and included 5 fencerow samples.
Physical properties: Interestingly, soil textures sampled were predominantly medium to coarse (silt loam to loamy sand), despite significant areas of fine-textured soils under production in the county. Only 3 samples were fine-textured (clay loam, silty clay loam), and 10 were coarse (sandy loam and loamy sand). The remaining samples were either loam or silt loam.
A-horizon (topsoil) depth ranged from 3.9 inches (9.9 cm) to 11.8 inches (28 cm), with an average of 8.5 inches (20.3 cm). Shallow topsoil is generally less productive and can be an indication of erosion. Topsoil depth less than 6 inches is limiting.
Aggregate stability is a measure of the extent to which soil aggregates resist falling apart when wetted and hit by rain drops. It is measured by the proportion of aggregates remaining intact after wet-sieving. The values ranged from 38% to 96% and averaged 71%. This is a measure where texture matters (figure 2 shows the scoring functions by texture), so the scores out of 100 are more useful. They ranged from 30 to 95, and six samples were of concern with scores below 70. Soils with low aggregate stability are more susceptible to wind and water erosion, as well as crusting and compaction, which can impact crop emergence and reduce water infiltration. Disturbance by tillage disrupts aggregation processes and diminishes aggregate stability.
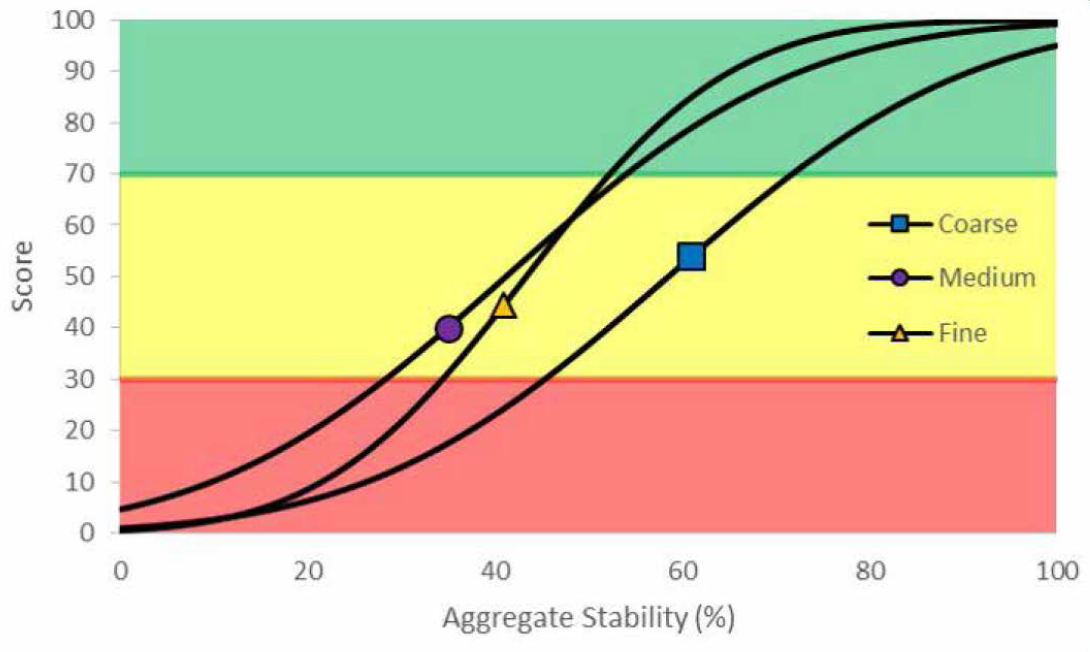 Figure 2. Scoring functions by texture for aggregate stability. Source: Comprehensive Assessment of Soil Health – The Cornell Framework Manual, 3rd ed.
Water infiltration rates should also be rated relative to soil texture, as loamy sand has more rapid inherent drainage than clay loam. Relative to the expected rate, 20% of the samples infiltrated water more slowly than they should. These values ranged from 0.6 minutes per inch of water (min/in) to 66 min/in, and the average was 11 min/in. This measure can be related to runoff during intense rain events – if an inch of rain fell in less than 10 minutes, 14 of the soils sampled could absorb it all, while the other 6 would experience surface runoff that could cause erosion.
Penetration resistance (a measure of subsurface hardness) becomes a limiting factor to root growth above 300psi. Ranging from 254psi to 550psi, the average penetration resistance recorded was 384psi, and the average score was 30/100. Only two samples were under the threshold of 300psi and this was the indicator that had the most results in the “poor” category. Care should be taken in the interpretation of penetrometer readings, as moisture content can be a significant variable. In fine-textured soils, firm aggregates may cause high readings even though sufficient space may exist between aggregates for water and roots to pass.
Chemical properties: In general, the sampled soils were slightly acid, with an average pH of 6.0. Ranging from 4.6 to 7.6, eleven samples were in need of lime (pH<6.0). Above pH 7.5, potassium availability decreases, as do some micronutrients. Only one sample was in this category.
Phosphorus (P) levels (Olsen/bicarbonate extraction) ranged from 6 ppm to 196 ppm. The average P level was 33 ppm (25 ppm excluding the sample at 196 ppm). Four samples were very low in P, though most were medium to high.
Potassium (K) levels were equally variable (52 ppm to 476 ppm, average of 135 ppm), with two samples very low and most medium or high. Three of the lowest testing samples were also very low for P, and the highest value for both was found in the same sample – beside a former barn.
Calcium and magnesium were also tested. Calcium levels ranged from 724 ppm to 3456 ppm, averaging 1602 ppm, and were all sufficient. Magnesium levels ranged from 66 to 420 ppm with an average of 189 ppm, and four were somewhat low. In each of these four cases pH was also low, so the obvious solution would be to use a dolomitic lime.
CEC was analyzed, but not rated. Though it is a crucial variable in soil fertility, it is difficult to rate as it depends on clay content, clay mineralogy, and organic matter content. For those soils with very little clay, strong correlations are present with OM. When significant clay is present, it is difficult to draw correlations without knowing the type of clay, which is beyond the scope of this project.
Biological properties: Organic matter (OM) levels ranged from 2.3 to 6.5%. The average OM content was 3.5%. Organic matter levels are also rated according to texture, and on this basis all but 6 samples were in the “good” or “very good” category.
Potentially mineralizable nitrogen (PMN) is an indicator of the capacity of the soil microbial community to convert (mineralize) nitrogen tied up in complex organic compounds from residues into the plant available form of ammonium, and is expressed as micrograms of N per gram of dry soil per week (μgN gdwsoil-1 week-1). The values ranged from 3.7 to 80.4, averaging 28.5 μgN gdwsoil-1 week-1. On an ordinal scale, this represents scores of 6-100. Seven samples were rated fair or poor, the rest good to very good. Six samples reached a perfect score of 100; five of these were fencerows, and one was in wheat.
Nematode samples were analyzed for total and parasitic nematodes. This analysis is an attempt to capture the state of the soil food web – healthy populations at higher trophic levels (i.e. predators) being an indication of a well-functioning soil ecosystem. Nematodes are represented at various trophic levels in the food web, with all but the plant parasitic nematodes being generally beneficial. If over 30% of the nematodes are parasitic, that is cause for concern. The samples ranged from 0.7% to 39% parasitic. Six samples had good to very good numbers of total nematodes, where a healthy number is 10,000 total nematodes. Only one sample had a population above 10,000. Interestingly, this was also the only sample that had over 30% of parasitic nematodes.
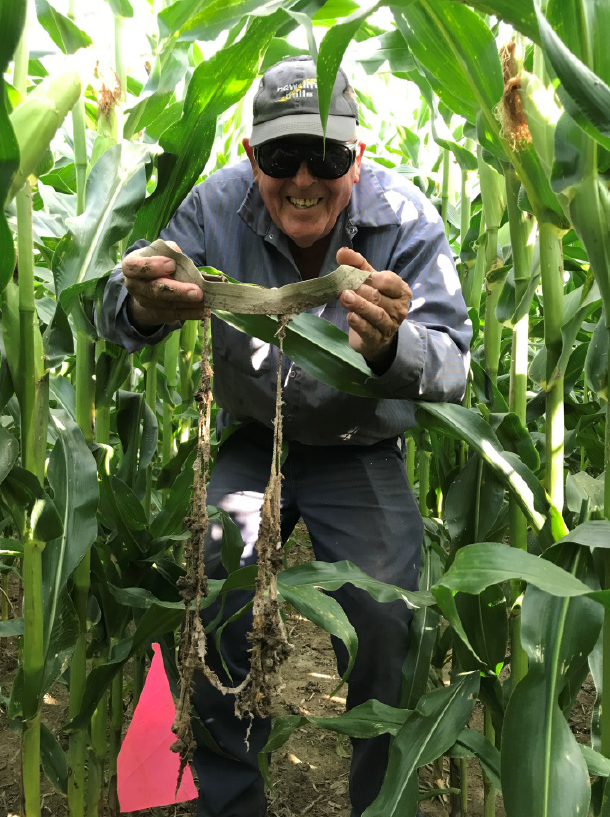 Figure 3. Cooperator Gerry Richards shows off his well-soiled undies. 50% weight loss in 70 days!
After about 70 days in the ground, the underwear were collected, meticulously hand washed, and weighed when dry. Final weight was compared to initial weight to determine percent weight lost. The average weight loss was 38%, ranging from 12% to 56%. The higher this figure, the more active and effective the soil biology, which also translates to faster residue decomposition in the field. A healthy soil makes a happy farmer!
Summary
Soil health is variable in those fields sampled in Renfrew County. While most samples scored relatively well on most indicators, none were without room for improvement, though a few came close.
Some easy answers were found; those soils with low magnesium also had low pH, both could be addressed with dolomitic lime.
This project reinforced the need for a more rounded assessment of the state of our soils beyond the typical soil fertility test, which includes only organic matter as a proxy for physical and biological soil quality.
Next Steps
Individual reports will be delivered to each participant once their Farmland Health Checkup workbooks are received. These will include recommendations for best management practices that could help to address the specific issues found on their fields.
More samples will give a more rounded picture of soil health in Renfrew County and make this assessment tool available to more producers to inform their management decisions.
Acknowledgements
Thanks to the participants for providing their fields and for completing the Farmland Health Check-up. Thanks to the summer students who helped with the sampling, especially those who were stuck with washing the underwear, and data entry. This project came together with help notably from Scott Banks and the very active members of the Renfrew SCIA.
Project Contacts
Adam Hayes (OMAFRA) adam.hayes@ontario.ca
Sebastian Belliard (OMAFRA) sebastian.belliard@ontario.ca
PDF - Soil Health Benchmarking Renfrew (CLICK HERE)
Appendix
Indicators measured in the Ontario Soil Health Assessment
Physical
• A horizon depth
• Aggregate stability
• Infiltration rate
• Subsurface hardness (penetrometer)
Chemical
• pH
• CEC
• P
• K
• Mg
• Zn
• Mn
Biological
• OM
• PMN
• Nematode total:parasitic