Purpose
No data exists on pasture yields in Ontario. While data on hay yields is often used as a proxy, this information is not timely for making on-farm grazing management decisions within the growing season. Farmers in other jurisdictions take on-farm grass cover measurements and use the data to inform grazing management decisions, but the most popular measuring tools (plate meters) require in-depth calibration before they can provide usable data.
This project assessed whether a plate meter could measure pasture cover in Ontario’s mixed stands accurately enough to be useful on farms, since the jurisdictions where plate meters are widely used rely on single-species stands that do not contain orchardgrass. The project also investigated whether different calibration equations would be needed for cattle and sheep, as these species have different grazing behaviours that affect the pasture canopy structure. Finally, the project also tried to determine when producers might need to switch between spring and summer calibration equations, since Ontario’s distinct seasons results in large differences in grass growth rate throughout the year.
The project topic supports animal and plant research theme priorities of production efficiency and OMAFRA’s key strategic priority of a thriving and sustainable agriculture sector by helping to drive economic efficiency and development. The program will address several industry priorities that would not otherwise be addressed to the extent required and provide capacity to deliver on industry needs.
Methods
Four farm sites were selected in the City of Kawartha Lakes and Durham Region in Ontario, Canada. All sites grazed ruminant livestock on perennial cool-season grass pastures throughout the spring and summer. Two sites grazed beef cattle; one was a cow-calf operation, the other backgrounded stockers. Two sites grazed dry ewes. Each farm site was visited weekly between May 12 and August 17 for sample collection.
A falling plate meter was constructed and calibrated as described by Rayburn and Lozier (2003), with the following modifications: a 30 cm x 30 cm piece of acrylic was used, rather than 45 cm x 45 cm, to keep construction costs for the plate meter under $50. More recent work suggests that drilling extra holes in the plate to aid in visual assessment of ground cover is unnecessary, so no holes beyond what was required for threading twine and inserting a metre stick were drilled. Grass samples were cut 5 cm above the ground, rather than at ground level, as this is the minimum recommended target grazing residual and grass shorter than 5 cm in height is not considered grazeable.
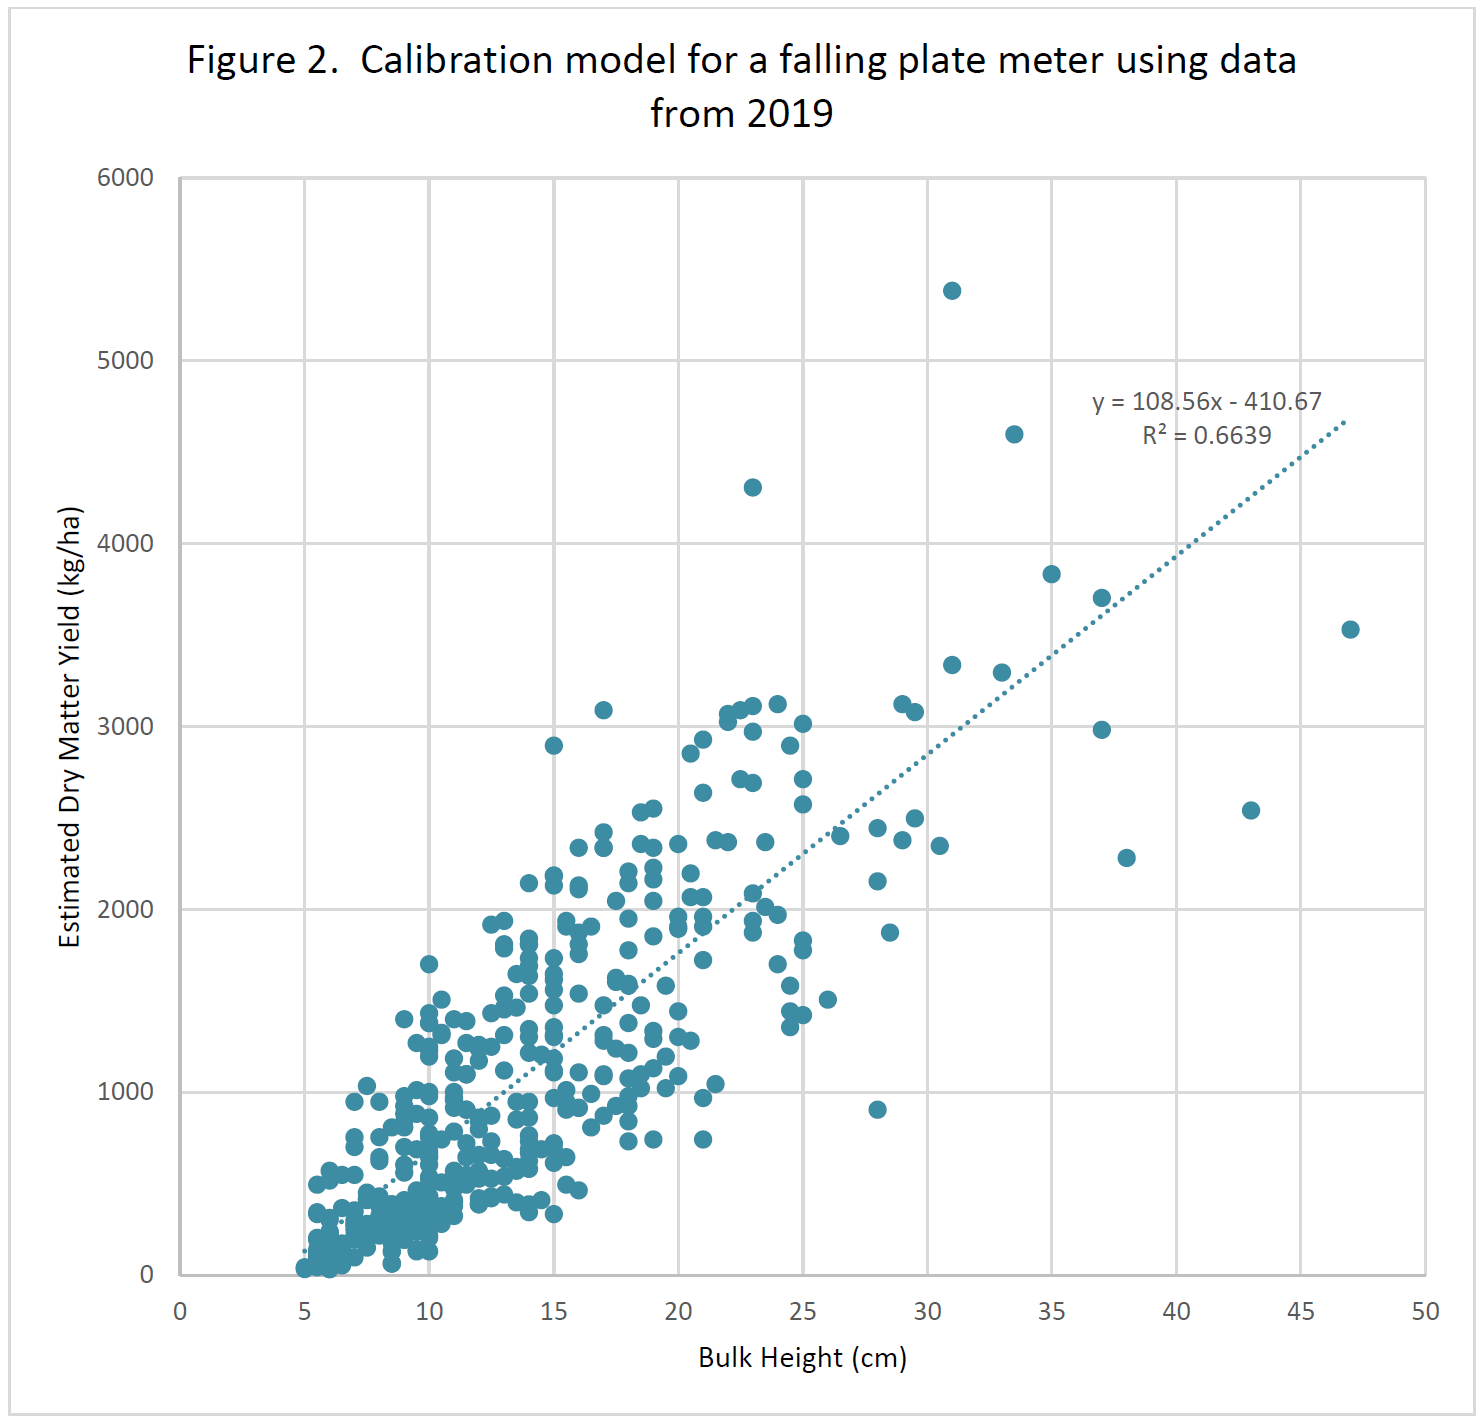
Data was analyzed using Microsoft Office 365 Excel. The software automatically found the regression model (linear, quadratic, etc.) that best fit the data. A regression was run on paired bulk height and cover data to establish a correlation coefficient for the entire sampling season across all sites. This equation provides a reference point for testing hypotheses on sliced data.
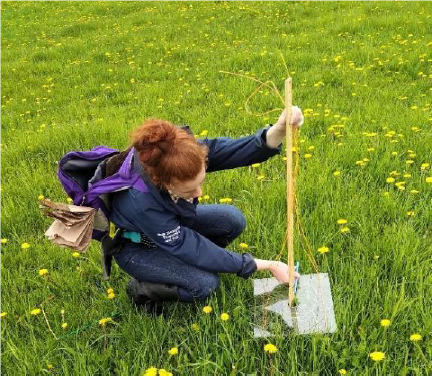 Figure 1. Using a falling plate meter to measure grass bulk height
Results
The correlation coefficient for all data collected during the 2019 sampling season is R2=0.6639 (Figure 2).
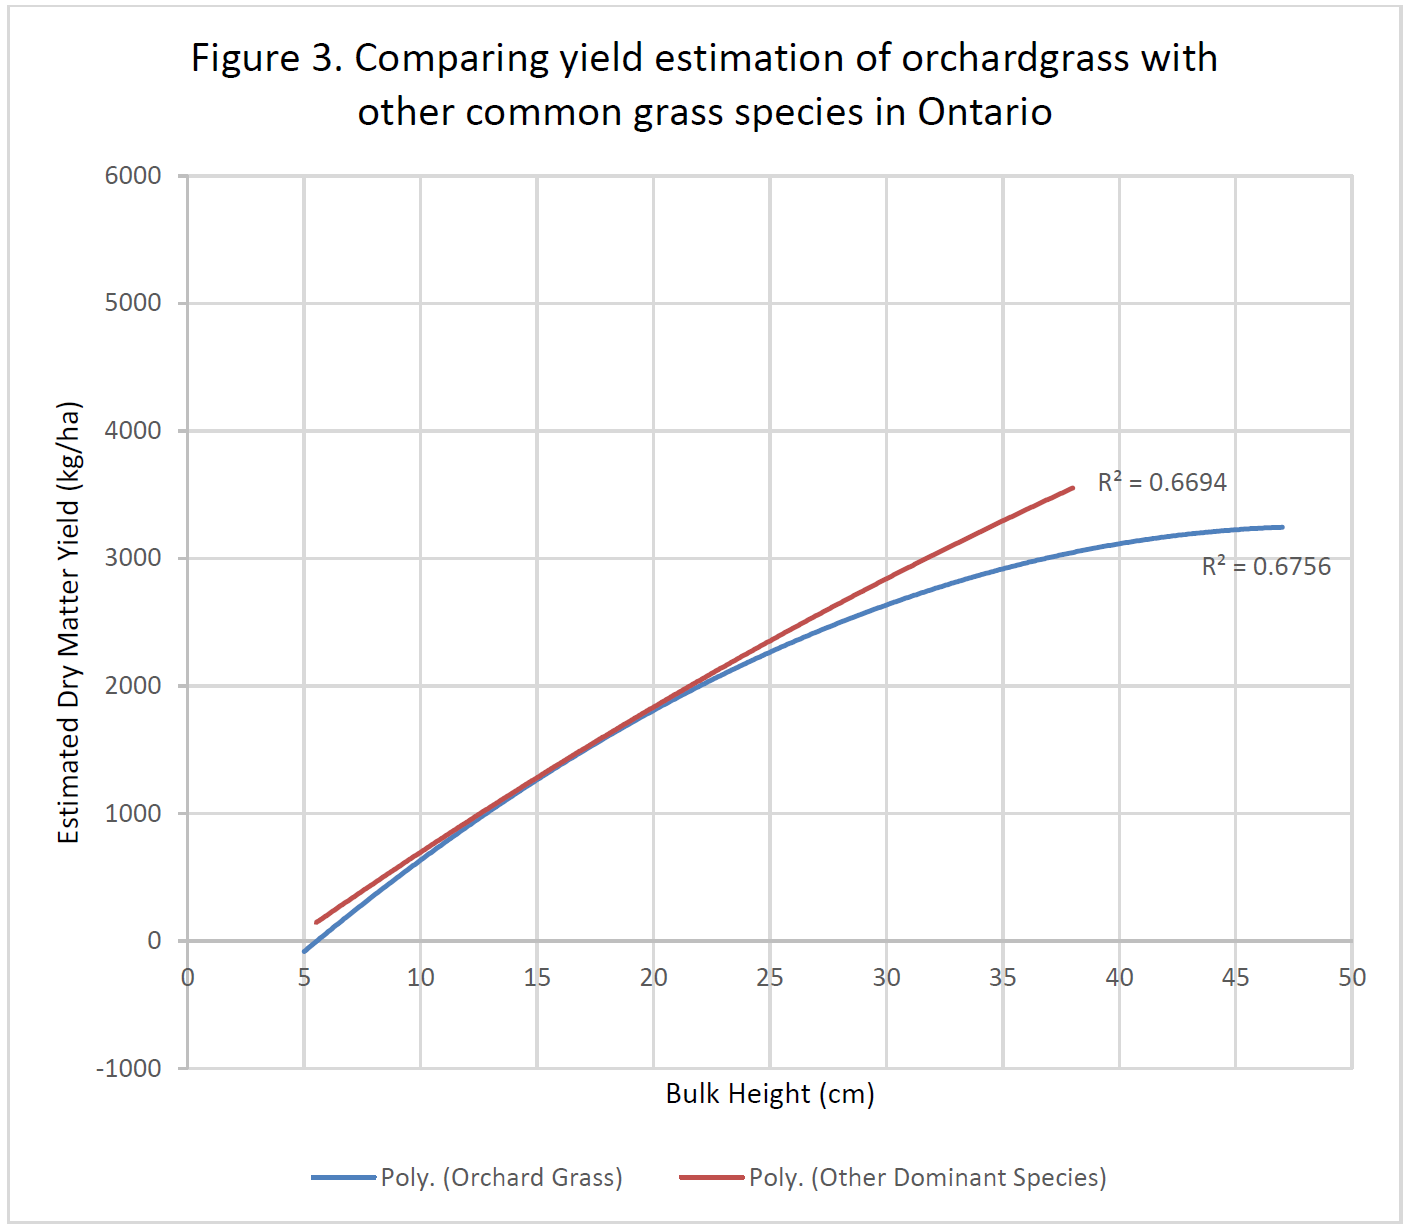
The correlation coefficient for orchardgrass-dominated samples is R2=0.6756. The correlation coefficient for samples dominated by other grass species is R2=0.6694 (Figure 3). The strength of these models is slightly stronger than modelling all data together.
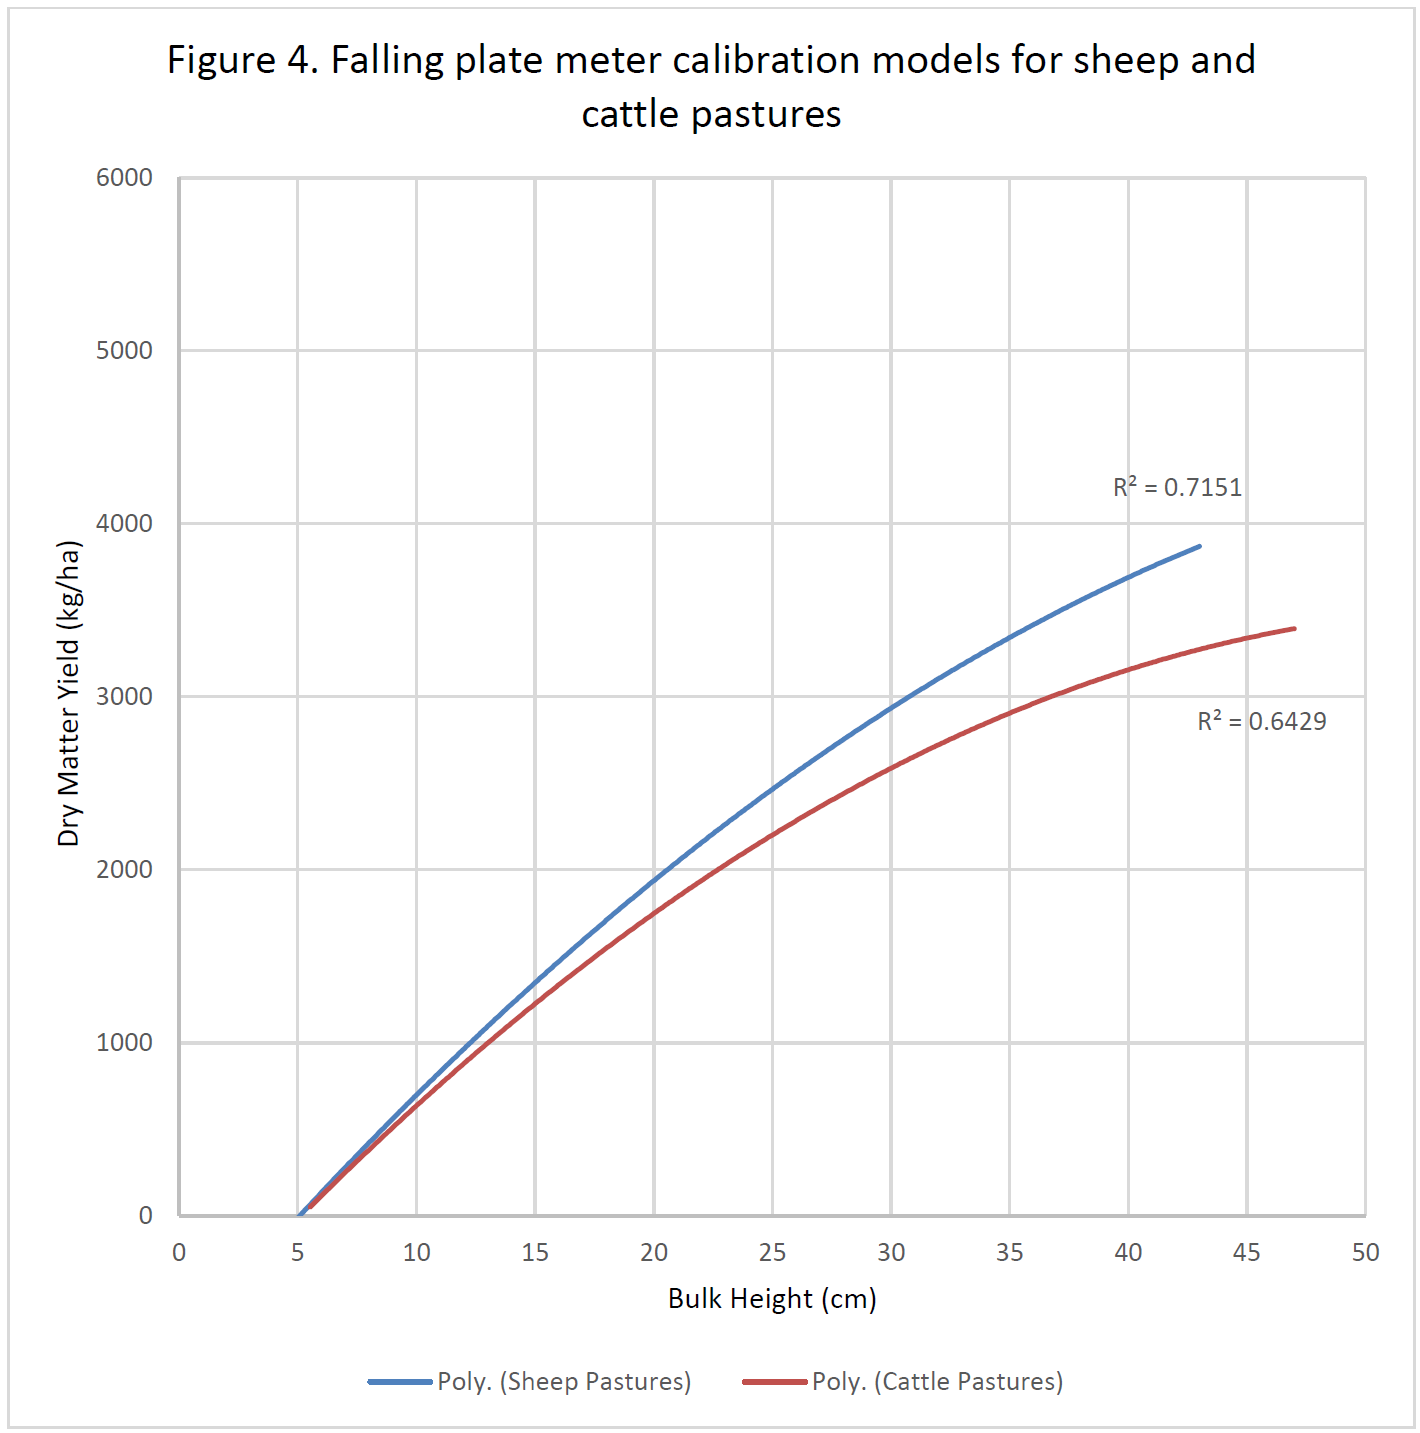
The correlation coefficient for cattle pastures is R2=0.6429. The correlation coefficient for sheep pastures is R2=0.7151 (Figure 4). Slicing the data by livestock species strengthens the calibration equation for sheep pastures, but somewhat weakens the equation for cattle pastures compared to modelling all data together.
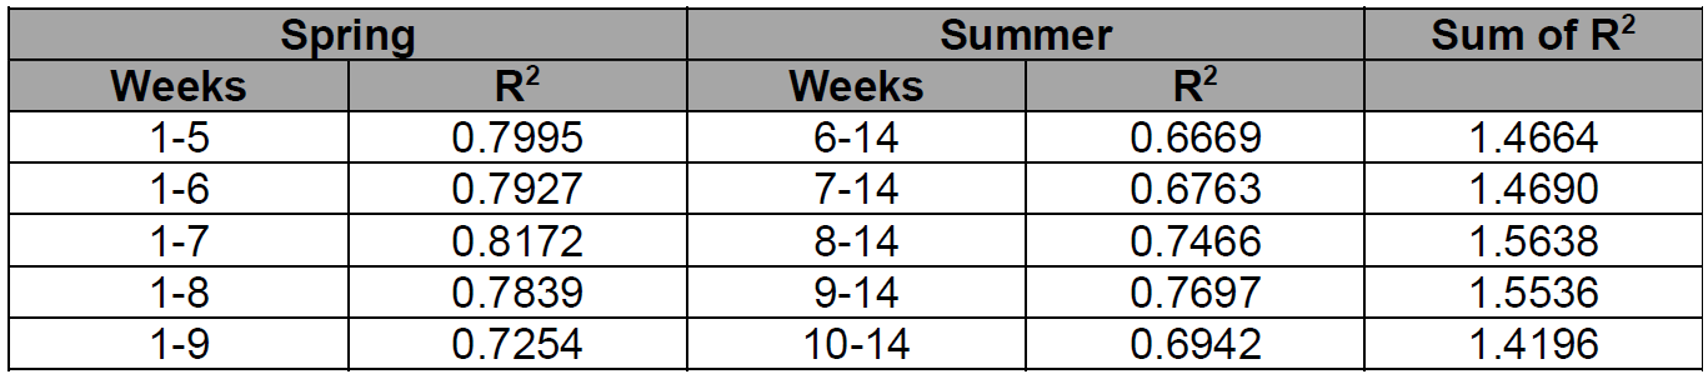
The spring and summer time periods with the highest correlation coefficients are weeks 1-7 (R2=0.8172) and weeks 9-14 (R2=0.7697) respectively. The spring + summer period with the highest summed correlation coefficients is weeks 1-7 + 8-14 (R2=0.7466), with a sum of 1.5638. This splits the 2019 sampling season into spring from May 12th to June 29th and summer from June 30th to August 17th. Table 1 summarizes the correlation coefficients for each period.
Summary
Overall, the correlation between bulk height and cover in Ontario pastures was moderately strong and justifies continuing this project over several growing seasons to develop a calibration model that is robust enough to be accurate under different weather conditions.
A major criticism of the falling plate meter as a pasture cover measuring tool for Ontario was the belief that tufts of thatch at the base of orchardgrass plants would cause the plate to overestimate cover. The correlation coefficients of models for all data, orchardgrass-dominated samples, and samples dominated by other grass species are numerically very close and indicate a moderately strong correlation between bulk height and cover. This suggests that the plate meter will be as accurate on orchardgrass-dominated pastures as on pastures comprised of other grass species.
A limitation of measuring cover with a falling plate meter is that it is only accurate on vegetative grasses. Grasses that are heading out have too much lignin in their stems to enable accurate measurements. This scenario is a result of under-utilizing the available grass. Likewise, when orchardgrass is not harvested often and aggressively, it forms tufts of thatch at the base. Good grazing management is required to enable a plate meter to accurately measure orchardgrass cover.
Slicing the data by livestock species increased the strength of the model for sheep. This suggests that the grazing behavior of cattle and sheep affect the density of a sward differently.
There were very strong seasonal effects on the correlation between bulk height and cover. Correlations between bulk height and cover were higher in spring than summer, regardless of where the slice between seasons occurred. Grasses are more likely to be vegetative in the early part of the growing season, so it is likely that more lignification in the summer data reduced the accuracy of bulk height estimates of cover.
Spring of 2019 was cool and wet, resulting in grass growth that was delayed two or three weeks later than normal. This may have pushed the switch date between spring and summer calibrations later than other years.
Next Steps
Based on learnings from the 2019 project, future work should:
- Develop different calibration models to be used for sheep and cattle pastures;
- Develop seasonal calibration equations for spring and summer; and
- Determine the optimal switch date between spring and summer equations.
More years of data are needed to develop robust calibration equations.
A falling plate meter was chosen for this pilot project for its low cost. A similar tool, the rising plate meter, offers the same level of accuracy and is easier to use. The results of the 2019 pilot indicate that the higher cost of a rising plate meter would be justifiable on farms once Ontario calibration equations exist. Future work will focus on calibrating the rising plate meter for Ontario conditions to improve the likelihood of this technology being adopted by producers.
Acknowledgements
Maja Menegotto, for her work collecting and analyzing the data.
Dr. Ira Mandell, for acting as Maja’s faculty mentor for this project.
The Undergraduate Student Experiential Learning (USEL) program is funded through the University of Guelph-OMAFRA Alliance agreement.
Farmer co-operators and Victoria County Community Pasture for participating in this project.
Project Contacts:
Christine O’Reilly, OMAFRA Forage and Grazing Specialist
christine.oreilly@ontario.ca 705-341-4899